Hyperliquid price has stayed resilient above key support levels despite a $340 million token unlock and wider crypto market weakness. Despite a decline in the overallHyperliquid price has stayed resilient above key support levels despite a $340 million token unlock and wider crypto market weakness. Despite a decline in the overall

Hyperliquid price holds bullish structure despite $340M unlock — will Coinbase listing boost HYPE further?

Okuma süresi: 4 dk

Hyperliquid price has stayed resilient above key support levels despite a $340 million token unlock and wider crypto market weakness.

Summary
  • HYPE continues to trade above its breakout zone near $32–$33, keeping its bullish structure intact.
  • Strong volume and limited sell-off suggest the recent unlock was largely priced in.
  • A fresh Coinbase listing adds near-term visibility as momentum stays constructive.

Despite a decline in the overall cryptocurrency market, Hyperliquid is up 2.9% on the day, trading at $34.80 at the time of writing. Most top-100 tokens posted losses, yet HYPE continued to attract buyers, maintaining a strong multi-week run.

The token is up 20% over the past seven days, 25% over the past month, and 36% year-over-year. Over the last week, Hyperliquid (HYPE) has traded between $28.23 and $37.84, showing wide but controlled price movement. Trading activity has surged alongside price, with daily volume jumping 65% to $1.31 billion.

Derivatives data support this trend. As per CoinGlass data, futures volume rose 33% to $5.43 billion, while open interest increased 2.3% to $1.59 billion. Rising price alongside growing open interest points to fresh positioning rather than short covering.

Token unlock pressure meets structural demand

On Feb. 6, roughly 9.92 million HYPE tokens were unlocked, roughly 2.8% of the circulating supply. At current prices, that equals about $340 million. The market absorbed the supply without experiencing major price fluctuations despite the large number of tokens entering circulation. 

According to Tokenomist data, approximately 395 million HYPE, or 40% of the entire supply, have already been made available. The majority of these tokens were reserved for distribution to the community, early ecosystem incentives, and core contributors. 

In a significant change, Hyperliquid also cut the number of team-related unlocks by 90%, resulting in a February allocation of about 140,000 HYPE, or about $4.5 million, instead of 1.2 million tokens. Monthly unlocks of around 9.9 million HYPE are expected through late 2027, though reduced team allocations could continue.

To offset supply pressure, the protocol uses an Assistance Fund that converts about 97% of trading fees into HYPE buybacks. Hyperliquid just posted a record $29 billion in 24-hour trading volume, generating close to $6 million in fees that feed directly into this mechanism.

Another tailwind came on Feb. 5, when Coinbase announced spot trading for HYPE/USD. Trading went live the same day, marking HYPE’s first appearance on a major U.S. exchange.

While HYPE had already been listed on Kraken and Gemini, Coinbase’s reach is often seen as more impactful, especially since it attracts U.S.-based institutional traders.

Hyperliquid price technical analysis

Technically, Hyperliquid’s bullish structure is still present. Price continues to hold above the former range high around $32–33, a level that has flipped into support. This area has now absorbed both market-wide weakness and the recent unlock.

Hyperliquid price holds bullish structure despite $340M unlock — will Coinbase listing boost HYPE further? - 1

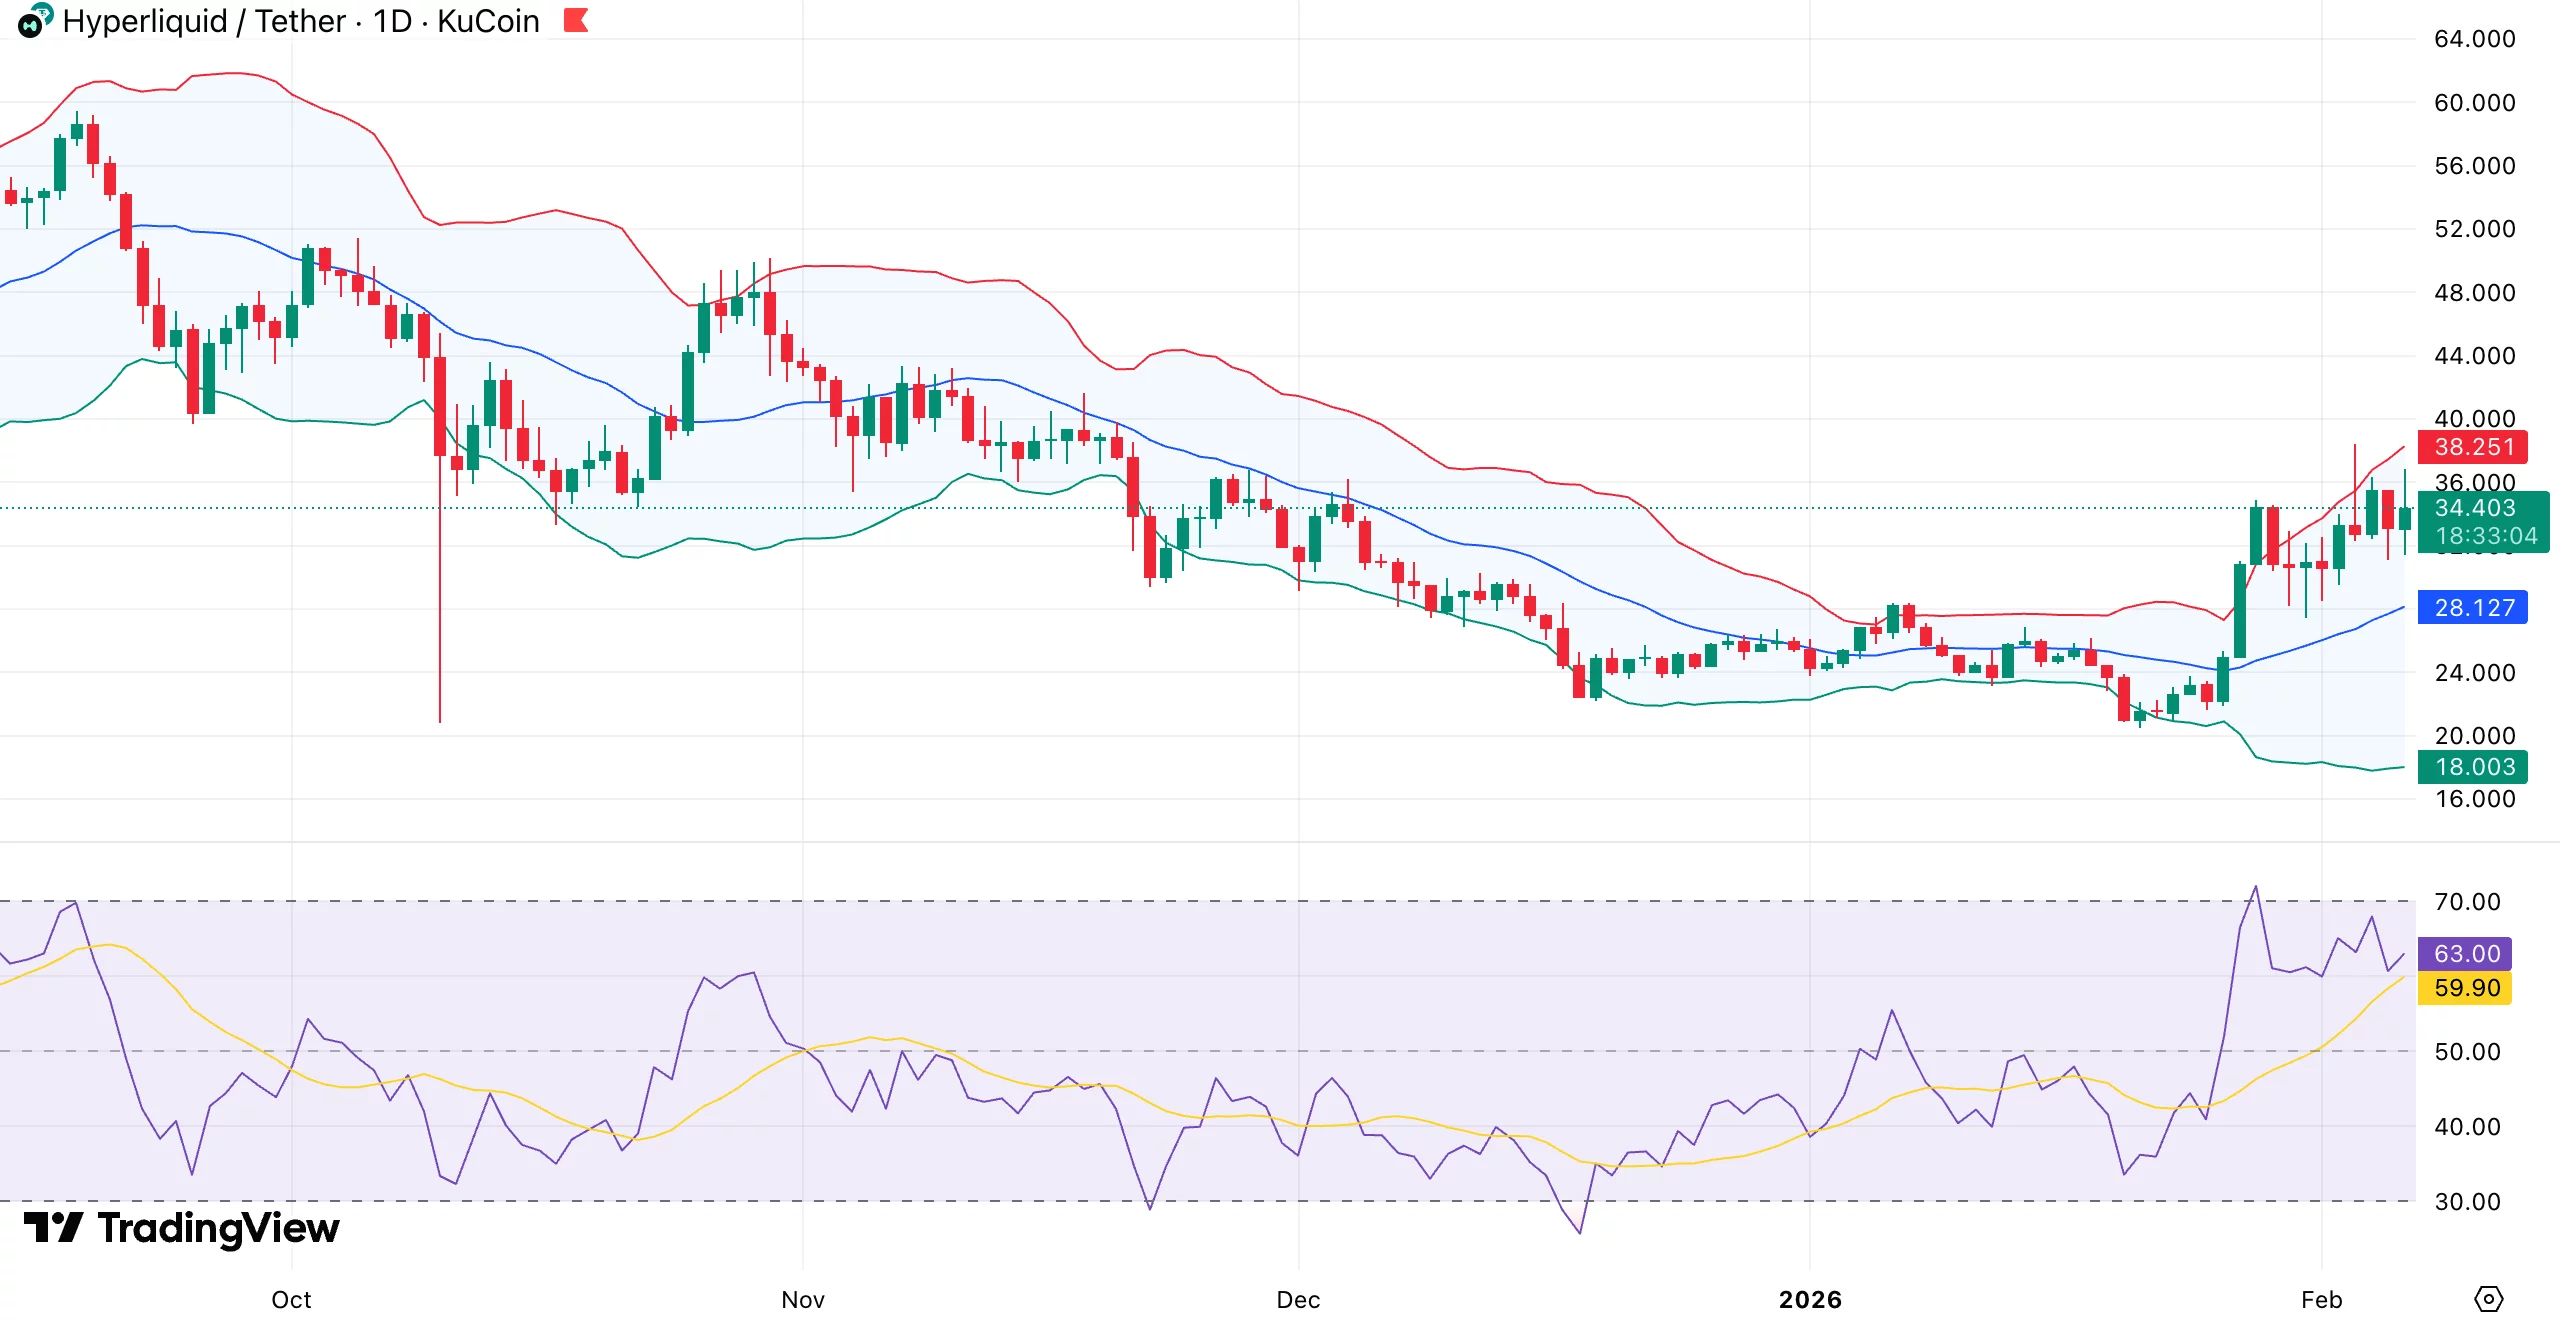
Buyers are taking advantage of pullbacks, as shown by a distinct sequence of higher lows. Since the breakout, the 20-day moving average has served as dynamic support, and the price is still above it. 

Bollinger Bands tightened following the initial rally, suggesting consolidation as opposed to distribution. The relative strength index is above 60, indicating that although momentum has slowed, buyers are still in charge of the trend. 

Downside follow-through after the unlock has been limited. Price hasn’t slipped back into the prior range, and recent red candles are small. This behavior suggests that much of the supply was priced in ahead of time.

If HYPE continues to hold above the $32–33 zone, the setup favors continuation toward the $38–40 area, especially if exchange-driven demand persists. Although the current structure still favors buyers, a clean daily close below that support would weaken the setup and pave the way for a deeper pullback.

Piyasa Fırsatı
Bullish Degen Logosu
Bullish Degen Fiyatı(BULLISH)
$0.008026
$0.008026$0.008026
+45.21%
USD
Bullish Degen (BULLISH) Canlı Fiyat Grafiği
Sorumluluk Reddi: Bu sitede yeniden yayınlanan makaleler, halka açık platformlardan alınmıştır ve yalnızca bilgilendirme amaçlıdır. MEXC'nin görüşlerini yansıtmayabilir. Tüm hakları telif sahiplerine aittir. Herhangi bir içeriğin üçüncü taraf haklarını ihlal ettiğini düşünüyorsanız, kaldırılması için lütfen service@support.mexc.com ile iletişime geçin. MEXC, içeriğin doğruluğu, eksiksizliği veya güncelliği konusunda hiçbir garanti vermez ve sağlanan bilgilere dayalı olarak alınan herhangi bir eylemden sorumlu değildir. İçerik, finansal, yasal veya diğer profesyonel tavsiye niteliğinde değildir ve MEXC tarafından bir tavsiye veya onay olarak değerlendirilmemelidir.

Ayrıca Şunları da Beğenebilirsiniz

Next Couple of Months Will Be Wild for XRP: Wealth Manager

Next Couple of Months Will Be Wild for XRP: Wealth Manager

Wealth manager Nate Geraci has reiterated his view that the coming months will be "wild" for XRP. This comes as the XRP community braces for another major milestone in the ETF space.Visit Website
Paylaş
The Crypto Basic2025/09/18 17:09
Top 5 Cryptocurrency Data APIs: Comprehensive Comparison (2025)

Top 5 Cryptocurrency Data APIs: Comprehensive Comparison (2025)

Photo by Pierre Borthiry - Peiobty on Unsplash Cryptocurrency APIs are essential tools for developers building apps (e.g. trading bots, portfolio trackers) and for analysts conducting market research. These APIs provide programmatic access to historical price data, real-time market quotes, and even on-chain metrics from blockchain networks. Choosing the right API means finding a balance between data coverage, update speed, reliability, and cost. In this article, we compare five of the most popular crypto data API providers — EODHD, CoinMarketCap, CoinGecko, CryptoCompare, and Glassnode — focusing on their features, data types (historical, real-time, on-chain), rate limits, documentation, and pricing plans. We also highlight where EODHD’s crypto API stands out in this competitive landscape. Overview of the Top 5 Crypto Data API Providers
  1. EODHD (End-of-Day Historical Data) — All-in-One Multi-Asset Data EODHD is a versatile financial data provider covering stocks, forex, and cryptocurrencies. It offers an unmatched data coverage with up to 30 years of historical data across the global For crypto, EODHD supports thousands of coins and trading pairs (2,600+ crypto pairs against USD) and provides multiple data types under one service. Key features include:
Historical Price Data: Daily OHLCV (open-high-low-close-volume) for crypto assets, with records for major coins going back to 2009 eodhd.com (essentially as far back as Bitcoin’s history). This extensive archive facilitates long-term backtesting. Real-Time Market Data: Live crypto price quotes via REST API and WebSocket. EODHD’s “Live” plan delivers real-time (typically streaming) updates with high rate limits (up to 1,000 requests/minute on paid plans) Developers can also use bulk API endpoints to On-Chain & Fundamental Data: While not an on-chain analytics platform per se, EODHD provides crypto fundamental metrics such as market cap (actual and diluted), circulating/total/max supply, all-time high/low, and links to each project’s whitepaper, block explorer These fundamentals give context beyond price, though advanced on-chain metrics (e.g. active addresses) are not included. Additional Features: EODHD stands out for its ease of use and support tools. API responses are clean JSON by default (with an option for CSV), and the service offers no-code solutions like Excel and Google Sheets add-ons to fetch crypto data without programming Comprehensive documentation and an “API Academy” with examples help users get started EODHD also provides 24/7 live customer support, reflecting its 7+ years of reliable service Pricing & Limits: EODHD’s pricing is very competitive for the value. It has a free plan (registration required) which allows 20 API calls per day for trying out basic Paid plans start at $19.99/month for end-of-day and live crypto data, allowing up to 100,000 calls per day— a generous limit that far exceeds most competitors at that price. The next tier ($29.99/mo) adds real-time WebSocket streaming, and the top All-in-One plan ($99.99/mo) unlocks everything (historical, intraday, real-time, fundamentals, news, etc.) All paid plans come with high throughput (up to 1,000 requests/min) Enterprise or commercial licenses are available for custom needs, and students can even get 50% discounts for educational Overall, EODHD offers an excellent price-to-performance ratio, giving developers extensive crypto (and cross-asset) data for a fraction of the cost of some single-purpose crypto APIs. 2. CoinMarketCap — Industry-Standard Market Data CoinMarketCap (CMC) is one of the most well-known cryptocurrency data aggregators. It provides information on over 10,000 digital assets and aggregates data from hundreds of CMC’s API is a go-to choice for current market prices, rankings, and exchange statistics. Key features include: Real-Time Quotes & Global Metrics: The API offers real-time price quotes, market capitalization, trading volume, and rankings for thousands of cryptocurrencies. It also provides global market metrics like total market cap, total volume, Bitcoin dominance, etc., updated (CMC’s data updates roughly every 1–2 minutes by default; true streaming is not yet available via their API.) Historical Data: Paid tiers unlock access to historical price data. CMC has data going back to 2013 for many assets, and enterprise plans provide all historical OHLCV data since 2013.The API endpoints include daily and even intraday historical quotes, but note that the free tier does not include historical price retrieval(free users get only latest data). Exchange and Market Endpoints: CoinMarketCap’s API covers exchange-level data (e.g. exchange listings, trading pair metadata, liquidity scores) and derivative market data (futures, options prices) on higher plans. This is useful for monitoring exchange performance and volumes across both centralized and decentralized exchanges. However, on-chain analytics are not CMC’s focus — the API doesn’t provide blockchain metrics like address counts or transaction rates. Developer Support: CMC provides comprehensive documentation and a straightforward RESTful JSON API . The endpoints are well-documented with examples, and categories include latest listings, historical quotes, metadata/info (project details), exchange stats, and The service is known for its reliability and is used by major companies (Yahoo Finance, for example, uses CoinMarketCap’s data feeds in its crypto Pricing & Limits: CoinMarketCap offers a free Basic plan with 10,000 credits per month (approximately 333 calls/day) and access to 11 core endpoint. The free tier is suitable for simple apps that only need current market data on a limited number of assets. To get historical data or higher frequency updates, you must upgrade. The Hobbyist plan starts at around $29/month (paid annually) and offers a higher monthly call allowance (e.g. ~50,000 calls/month) and more endpoints. Mid-tier plans like Startup ($79/mo) and Standard ($199/mo) increase the rate limits and data access — e.g., more historical data and additional endpoints like derivatives or exchange listings. For example, Standard and above allow intraday historical quotes and more frequent updates. Professional/Enterprise plans ($699/mo and up, or custom) provide the highest limits (up to millions of calls per month), full historical datasets, and SLA . Rate limits on CMC are enforced via a credit system; different endpoints consume different credits, and higher plans simply grant more credits per month. In summary, CoinMarketCap’s API is very robust but can become expensive for extensive data needs — it targets enterprise use cases with its upper tiers. Smaller developers often stick to the free or Hobbyist plan for basic data (while accepting the lack of historical data in those tiers) 3. CoinGecko — Broad Coverage & Community Focus CoinGecko is another hugely popular cryptocurrency data provider known for its broad coverage and developer-friendly approach. CoinGecko’s API is often praised for having a useful free offering and covering not just standard market data but also categories like DeFi, NFTs, and community metrics. Notable features: Wide Asset Coverage: CoinGecko tracks over 13,000 cryptocurrencies (including many small-cap and emerging tokens). It also includes data on NFT collections and decentralized finance (DeFi) tokens and protocols. This makes it one of the most comprehensive datasets for the crypto market. If an asset is trading on a major exchange or DEX, CoinGecko likely has it listed. Market Data and Beyond: The API provides real-time price data, market caps, volumes, and historical charts for all these assets. Historical data can be retrieved in the form of market charts (typically with daily or hourly granularity depending on the time range). Additionally, CoinGecko offers endpoints for exchange data, trading pairs, categories (sectors), indices, and even asset contract info (mapping contract addresses to CoinGecko listings). They also expose developer and social metrics for each coin — e.g. GitHub repo stats (forks, stars, commits) and social media stats (Twitter followers, Reddit subscribers) This is valuable for analysts who want to gauge community interest or development activity alongside price. No WebSockets — REST Only: CoinGecko’s API is purely REST-based; there is no built-in WebSocket streaming. Data updates for price endpoints are cached at intervals (typically every 1–5 minutes for free users, and up to every 30 seconds for Pro users). So while you can get near-real-time data by polling, ultra-low-latency needs (like high-frequency trading) are better served by other providers or exchange-specific APIs. Documentation & Use: The API is very straightforward to use — in fact, for the free tier no API key was required historically (though recently CoinGecko introduced an optional “Demo” key for better tracking). A simple GET request to an endpoint like /simple/price returns current prices. CoinGecko’s documentation is clear, and they even highlight popular endpoints and provide examples. Because of its simplicity and generous free limits, CoinGecko’s API has been integrated into countless projects and tutorials. Pricing & Limits: CoinGecko operates a freemium model. The free tier (now referred to as the “Demo” plan) allows about 10–30 calls per minute (the exact rate is dynamic based on system load) In practical terms, that’s roughly up to 1,800 calls/hour if usage is maxed out — very sufficient for small applications. The free API gives access to most endpoints and data (including historical market charts) but with lower priority and slower update frequency. For higher needs, CoinGecko offers paid plans: Analyst, Lite, and Pro. For example, the Analyst plan (~$129/mo) offers 500,000 calls per month at 500 calls/minute rate limit, the Pro plan (~$499/mo) offers 2,000,000 calls/mo at the same rate, and an Enterprise plan (~$999/mo and up) can be tailored for even larger volumes. Paid plans also use a separate pro API endpoint with faster data updates (prices cached every 30 seconds) and come with commercial usage rights and support SLA Notably, CoinGecko’s free plan is one of the best among crypto APIs in terms of data offered for $0, but if you need heavy usage or guaranteed uptime, the cost can ramp up — at the high end, large enterprise users might negotiate custom plans beyond the listed Pro tier.
  1. CryptoCompare — Full Market Data + More CryptoCompare is a long-standing crypto data provider that offers a rich set of market data and analytics. It not only provides price data but also aggregates news, social sentiment, and even some on-chain data, making it a comprehensive source for crypto market Key features of CryptoCompare’s API include:
Market Data & Exchange Coverage: CryptoCompare covers 5,700+ coins and 260,000+ trading pairs across a wide array of exchanges. It collects trade data from more than 170 exchanges (both centralized and some decentralized) to produce its aggregate indices (known as CCCAGG prices). The API provides real-time price quotes, order book snapshots, trade history, and OHLCV candlesticks at various intervals. For advanced users, CryptoCompare can supply tick-level trade data and order book data for deep analysis (these are available via their WebSocket or extended API endpoints). Historical Data: CryptoCompare is strong in historical coverage. It offers historical daily data for many coins and historical intraday (minute) data as well. By default, all subscription plans include at least 7 days of minute-level history and full daily history; enterprise clients can get up to 1 year of minute-by-minute historical data (and raw trade data) for backtesting. This is valuable for quantitative researchers who require detailed price series. On-Chain Metrics and Other Data: In addition to market prices, CryptoCompare has expanded into on-chain metrics and alternative data. The API can provide certain blockchain statistics (they mention “blockchain metrics” and address data in their offerings)— for example, network transaction counts or wallet addresses for major chains. While it’s not as extensive as a dedicated on-chain provider, this allows blending on-chain indicators (like transaction volumes) with price data for analysis. CryptoCompare also integrates news feeds and social sentiment: the API has endpoints for the latest news articles and community sentiment analysis, which can help gauge market Reliability and Performance: CryptoCompare’s infrastructure is built for high performance. They claim support for up to 40,000 API calls per second bursts and hundreds of trades per second This makes it suitable for real-time applications and dashboards that need frequent updates. Their data is normalized through a proprietary algorithm to filter out bad data (e.g., outlier prices or exchange anomalies), aiming to deliver clean and consistent price indices (CCCAGG). The API itself is well-documented, and client libraries exist for languages like Python. Pricing & Limits: CryptoCompare historically offered a free public API (with IP-based limiting), but now uses an API key model with tiered plans. Personal/free use is still allowed — you can register for a free API key for non-commercial projects and get a decent allowance (exact call limits aren’t explicitly published, but users report free tiers on the order of a few thousand calls per day). For commercial or heavy use, their plans start around $80/month for a basic package and go up to ~$200/month for advanced packages. These plans might offer on the order of 100k to a few hundred thousand calls per month, plus higher data resolution. All plans grant access to ~60+ endpoints and features like full historical data download for daily/hourly (minute data beyond 7 days is enterprise-only). Enterprise solutions are available for customers needing custom data feeds, unlimited usage, white-label solutions, or bespoke datasets (pricing for these is via negotiation). In summary, CryptoCompare provides a very rich dataset and is priced in a mid-range: not as cheap as community resources, but more affordable than some institutional-grade providers. Its value is especially high if you need a mix of price, news, and basic on-chain data in one
  1. Glassnode — On-Chain Analytics Leader Glassnode is the premier platform for on-chain metrics and blockchain analytics. Unlike the other APIs in this list, Glassnode’s focus is less on real-time market prices and more on the fundamental health and usage of blockchain networks. It provides a wealth of on-chain data that is invaluable for crypto analysts and long-term investors. Key aspects of Glassnode’s API:
Extensive On-Chain Metrics: Glassnode offers over 800 on-chain metrics spanning multiple major blockchains (Bitcoin, Ethereum, Litecoin, and many others, as well as key ERC-20 tokens). This includes metrics like active addresses, transaction counts, transaction volumes, mining hash rates, exchange inflows/outflows, UTXO distributions, HODLer stats, realized cap, SOPR and much more. If you need to peer ino what’s happening inside a blockchain (not just its price on exchanges), Glassnode is the go-to source. For example, one can query the number of active Bitcoin addresses, the amount of BTC held by long-term holders vs. short-term, or Ethereum gas usage trends Market & Derivatives Data: In addition to pure on-chain data, Glassnode also incorporates off-chain market data for context. They provide spot price data for major assets (often used in tandem with metrics in their charts), and even some derivatives metrics (futures open interest, funding rates, etc. for major exchanges) at higher . This means Glassnode can be a one-stop shop for an analyst who wants to correlate on-chain activity with price movements or derivative market trends. Data Resolutions and API Access: The API allows retrieval of metrics at various time resolutions. Free users can typically access metrics at a daily resolution (one data point per day) and usually with a delayed timeframe (e.g. yesterday’s data). Paid tiers unlock higher frequency data — the mid-tier (Advanced) gives up to hourly data, and the top tier (Professional) can go down to 10-minute intervals for certain metrics This granularity is useful for near-real-time monitoring of on-chain events. It’s important to note that Glassnode’s API is primarily used for pulling time-series data of specific metrics (e.g., get the 24h moving average of active addresses, daily, over the last 5 years). The API is well-documented with a metric catalog detailing every metric and its available history and access tier. Analyst Tools: Glassnode provides an entire platform (Glassnode Studio) for visualizing these metrics with charts and alerts. While that’s beyond the API itself, it’s worth noting that many analysts use the web interface for research and the API for programmatic access when building models. Glassnode has become an industry standard for on-chain analysis — many research reports and crypto funds cite Glassnode metrics for insights on network adoption, investor behavior, and market cycles. Pricing & Limits: Glassnode’s offerings are tiered more by data access level than raw call counts. They have a Standard (Free) tier, an Advanced (Tier 2) paid tier, and a Professional (Tier 3) tier. The Free tier allows access to Basic metrics (Tier 1 metrics) at daily resolution, which covers a lot of fundamental data for major chains but not the more complex or derived metrics. The Advanced plan (around $29–$49 per month depending on promotions) unlocks Essential metrics (Tier 2) and provides up to hourly . The Professional plan (around $79 per month for individuals) gives access to all metrics (including Premium Tier 3 metrics) and finer resolution (10-min updates). However, there’s a catch: API access is only officially included for Professional/Enterprise users and may require a special add-on or enterprise . In practice, Glassnode does offer a free API but it is limited (e.g., you can query basic metrics via REST with a free API key, but many endpoints will return only if you have the right subscription). Enterprise clients who need programmatic access to extensive history or want to ingest Glassnode data into trading models can arrange custom packages (cost can run into the hundreds or thousands of dollars monthly for institutional licenses, which may include SLAs, custom metrics, or priority support). For the purpose of our comparison, Glassnode’s free option is great for community analysts to explore a subset of data, but serious use of their API requires the paid tiers. Glassnode is best suited for analysts and institutional users who heavily value on-chain rather than developers who just need straightforward price feeds. The table below summarizes the data coverage and features of these five API providers side-by-side: Ready to build with crypto data that just works? If you want reliable crypto prices + multi-asset coverage (stocks, FX, ETFs) + generous limits without piecing together 3–4 vendors, EODHD is the pragmatic pick. Why EODHD wins for most teams All-in-one: crypto + equities + FX under one API (consistent JSON/CSV). Great value: up to 100k calls/day from ~$19.99/mo — perfect for MVPs and production apps. Fast start: clean docs, code samples, Excel/Sheets add-ins, and bulk endpoints. Scale-ready: real-time REST & WebSocket, historical OHLCV, fundamentals, news. What you can ship this week Real-time crypto dashboards and alerts Backtests using years of OHLCV data Cross-asset analytics (BTC vs. S&P 500, ETH vs. USD) Spreadsheet models that refresh automatically 👉 Start for free with EODHD — grab your API key and make your first request in minutes.Try EODHD now (free tier available) and upgrade when you need more throughput. Top 5 Cryptocurrency Data APIs: Comprehensive Comparison (2025) was originally published in Coinmonks on Medium, where people are continuing the conversation by highlighting and responding to this story
Paylaş
Medium2025/09/26 21:29
XRP Price Outlook As Peter Brandt Predicts BTC Price Might Crash to $42k

XRP Price Outlook As Peter Brandt Predicts BTC Price Might Crash to $42k

The post XRP Price Outlook As Peter Brandt Predicts BTC Price Might Crash to $42k appeared on BitcoinEthereumNews.com. XRP price led cryptocurrency losses on Friday
Paylaş
BitcoinEthereumNews2026/02/06 19:06