

XRP Price Prediction: Expert Says XRP Will Create Millionaires
Key highlights:
- XRP has fallen into the $1.15–$1.18 support zone after losing key technical levels.
- Analyst sees potential targets at $3.14, $8.88, and $9.36 if support holds.
- XRP market cap has dropped to $73–$75 billion, though regulatory and network catalysts remain in play.
XRP has had a rough stretch lately. After failing to hold above the $1.30–$1.35 area, the XRP price slipped below several important support levels and is now trading near the lower end of a major accumulation zone.
Despite that weakness, some analysts remain extremely bullish on where XRP could go over the next few years. One of them is prominent analyst Crypto Patel, who recently shared a chart arguing that XRP could create a wave of new millionaires in the coming cycle, especially among investors who accumulated below $1.
The bigger XRP picture still looks bullish
We had a look at Patel’s monthly chart, and his bullish thesis starts with a breakout that took years to develop. For much of the period between 2018 and 2025, XRP remained trapped beneath a descending resistance trendline.
Every major rally eventually ran into that barrier and failed. That finally changed when XRP broke above the trendline, ending a multi-year consolidation phase. Patel identifies two major accumulation zones.
The first sits below $1, where early buyers accumulated positions during the bear market. The second zone ranges roughly between $1.23 and $1.35 and acts as the current re-accumulation area. This is exactly where the XRP price has been pulling back after its latest rally.
From a long-term perspective, the structure remains intact as long as XRP continues to hold the broader support region between $1.00 and $1.35. Patel’s chart points to $3.14 as the first major upside target, followed by $8.88 and $9.36 if the next bull cycle develops as expected.
The latest monthly candle has been weak, but it remains inside a historically important demand zone. For long-term holders, that keeps the broader bullish case alive.
The short-term charts tell a different story
The lower timeframes aren't nearly as optimistic. We had a look at the 4-hour XRP chart, and the recent breakdown is pretty clear. XRP failed to stay above the $1.30–$1.35 region and printed a clean break of structure to the downside.
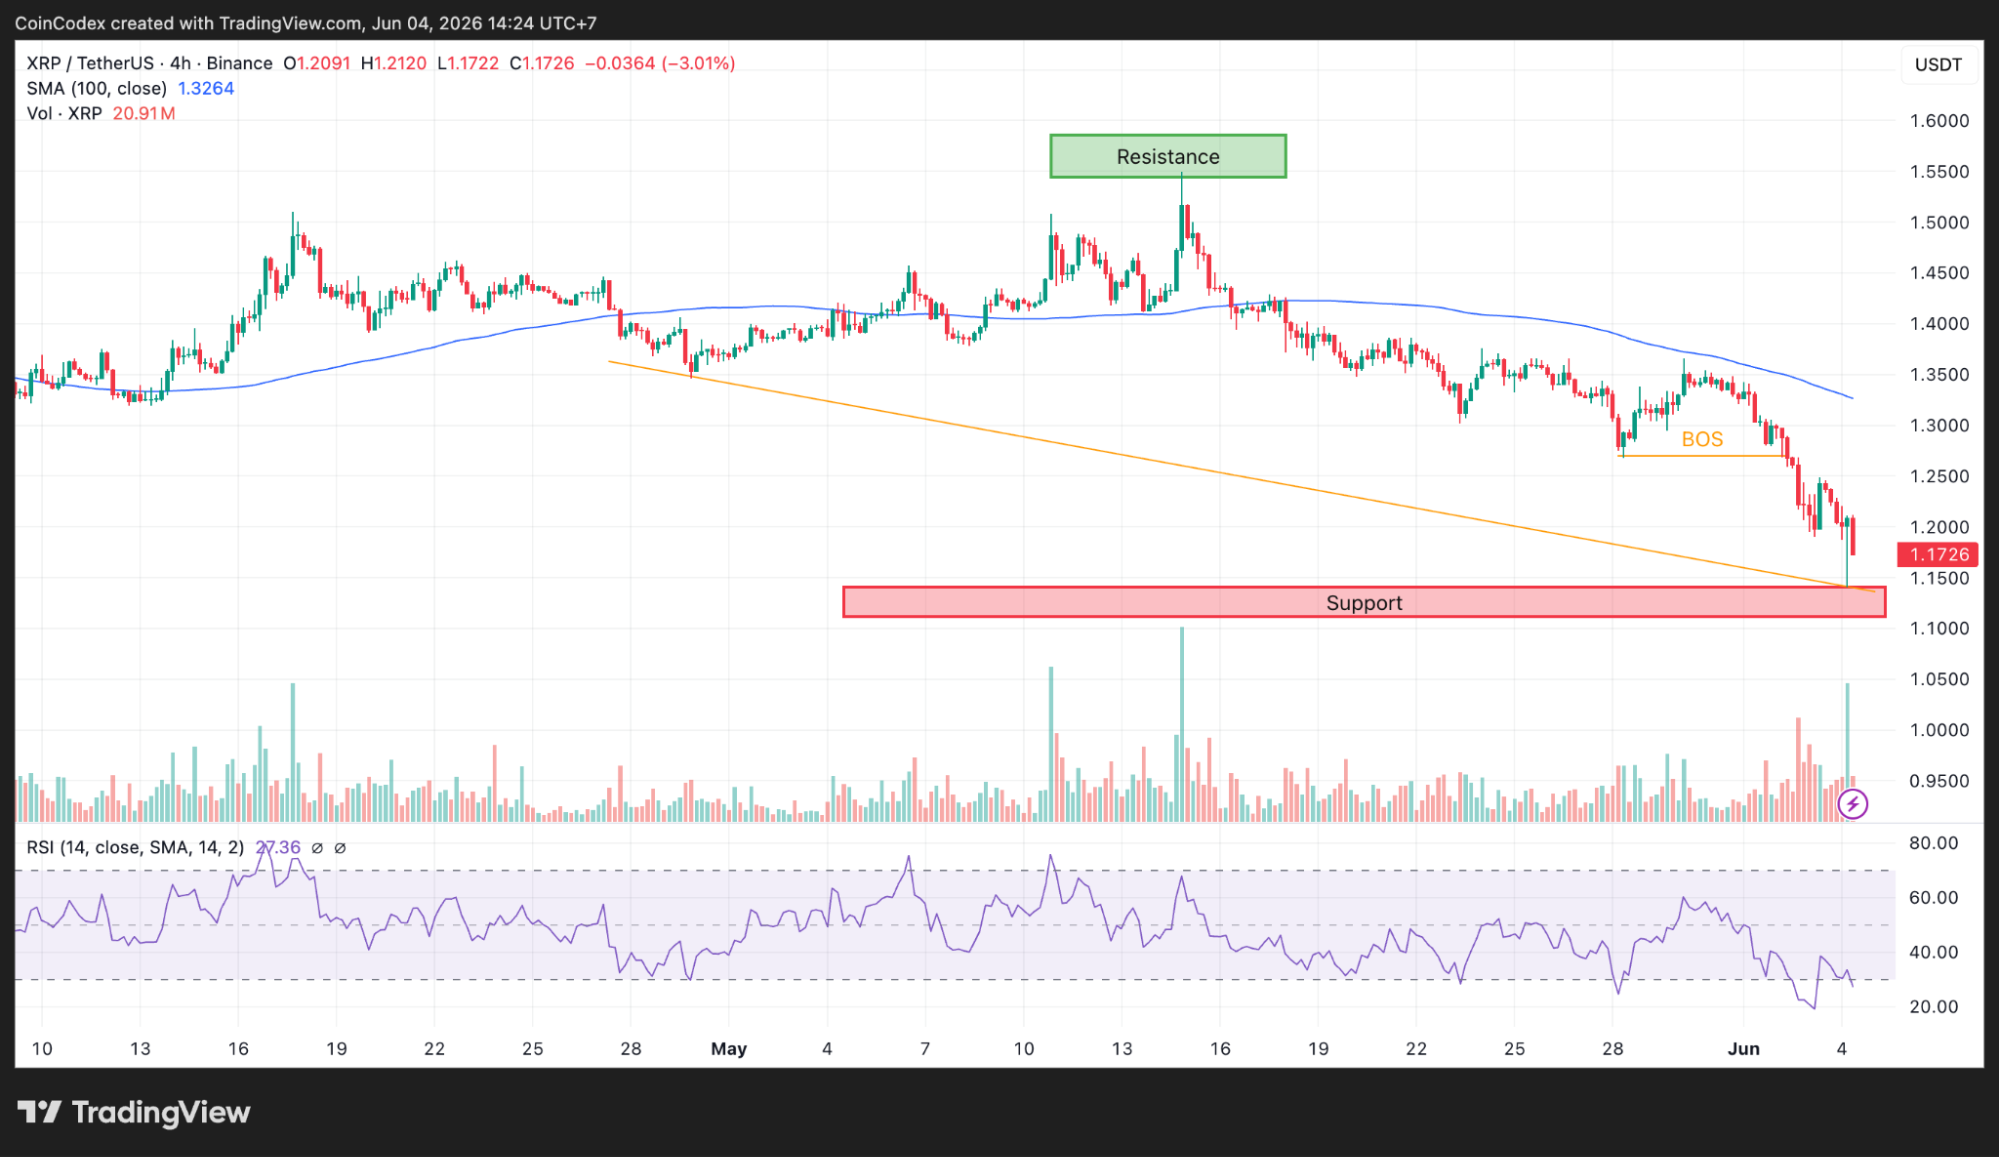
4-hour XRP chart analysis
The XRP price has fallen to around $1.16 and now trades well below the 100-period SMA at $1.3264. That moving average has flipped from support into resistance, which is never a great sign in the short term. Momentum indicators show how aggressive the selling has been. RSI on the 4-hour chart has dropped to 27.36, placing XRP in oversold territory.
The daily chart looks similar. XRP dipped below its daily 100 SMA at $1.3820 and the key descending trendline too. The daily RSI tanked to 24.08, one of the lowest points we've seen in a while.
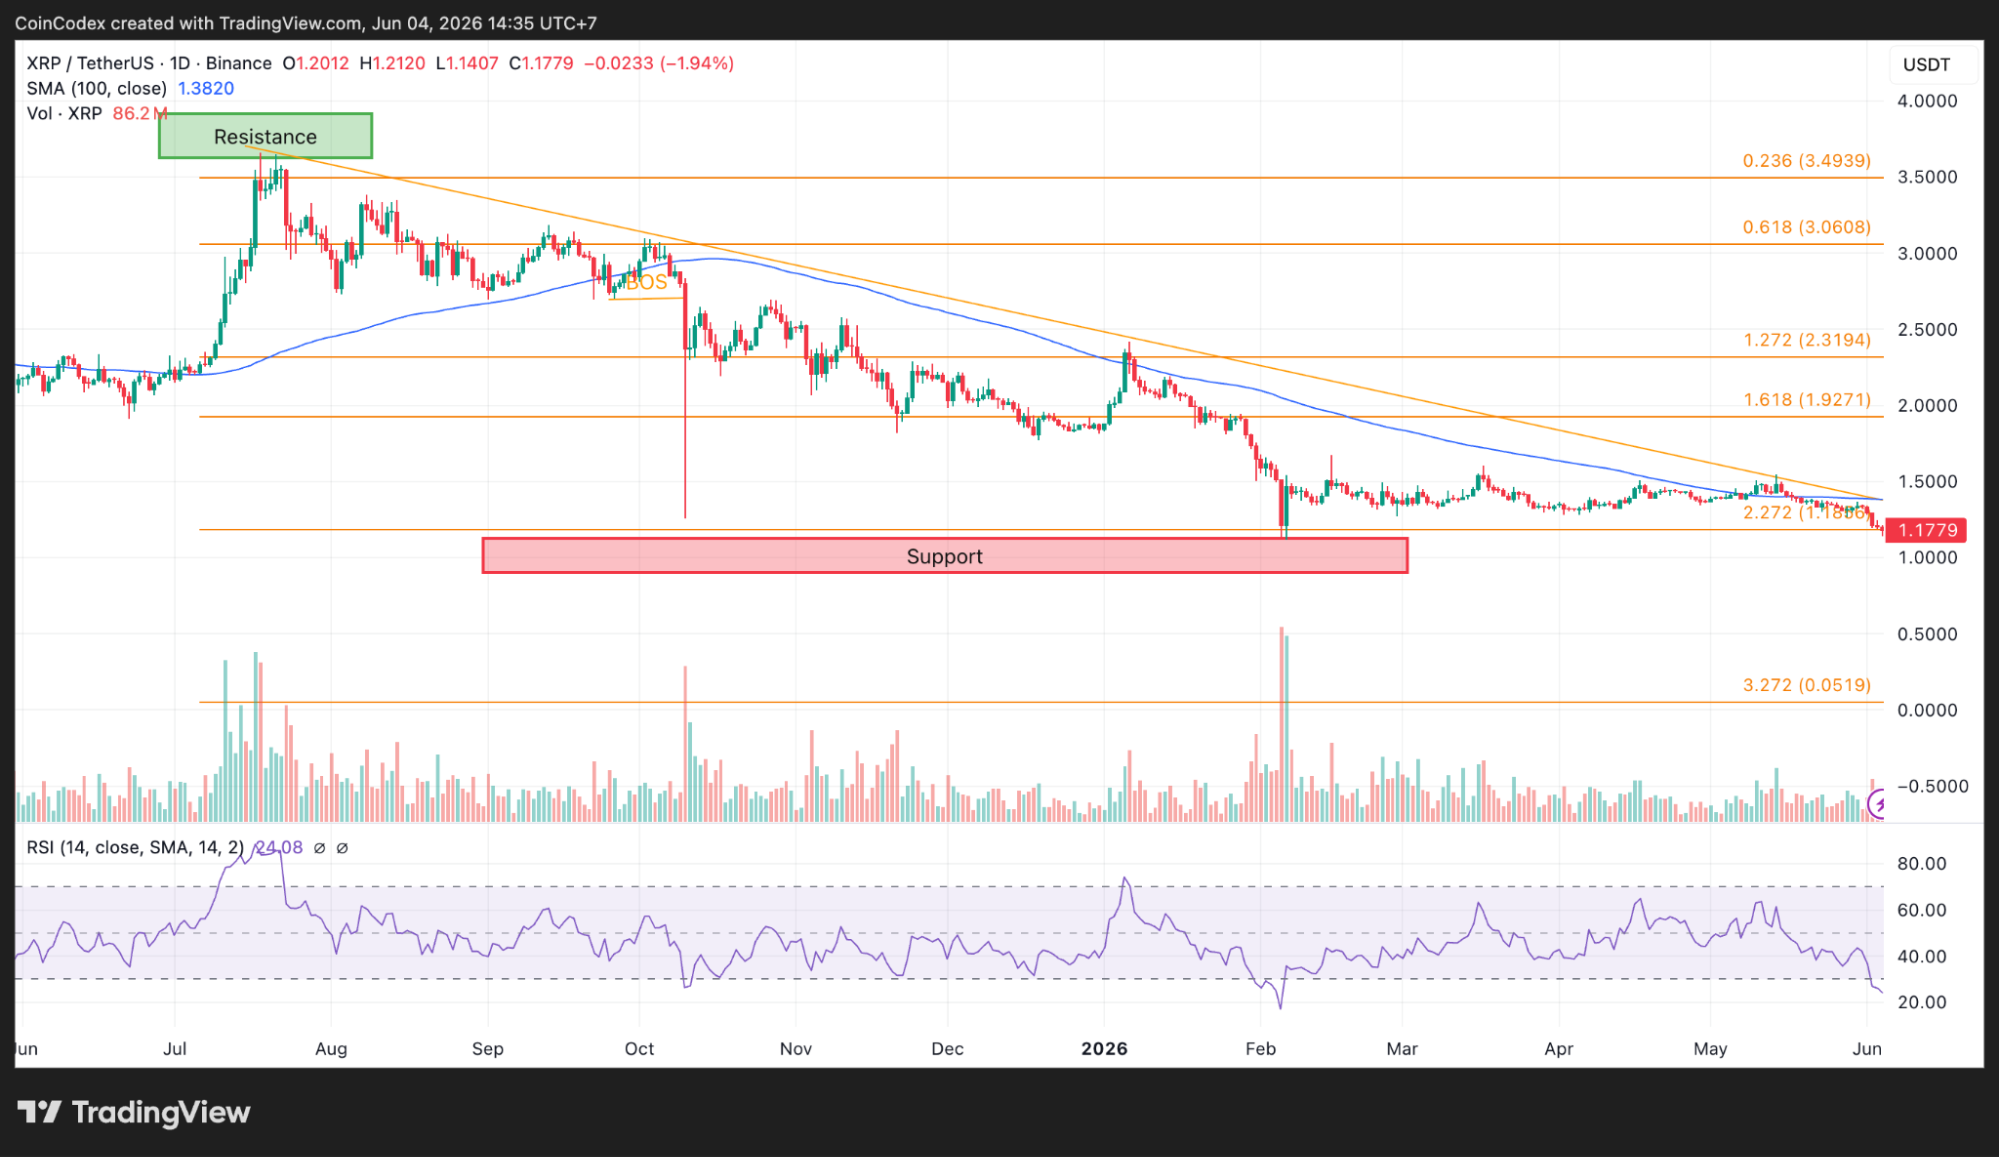
Daily XRP chart analysis
Although that doesn't promise an instant recovery, it might mean sellers are about tired out. The crucial range now is between $1.15 and $1.18. If buyers hold that line, we could see a rebound up to $1.25 or even $1.30. If not, XRP might head down towards $1.10.
On-chain data shows XRP is still in a cooling-off phase
The weakness isn't limited to the charts. We had a look at XRP's on-chain data from Glassnode, and they paint a similar picture. Market capitalization climbed to nearly $97 billion before beginning a steady decline. Recent readings place XRP's market cap closer to $73–$75 billion.
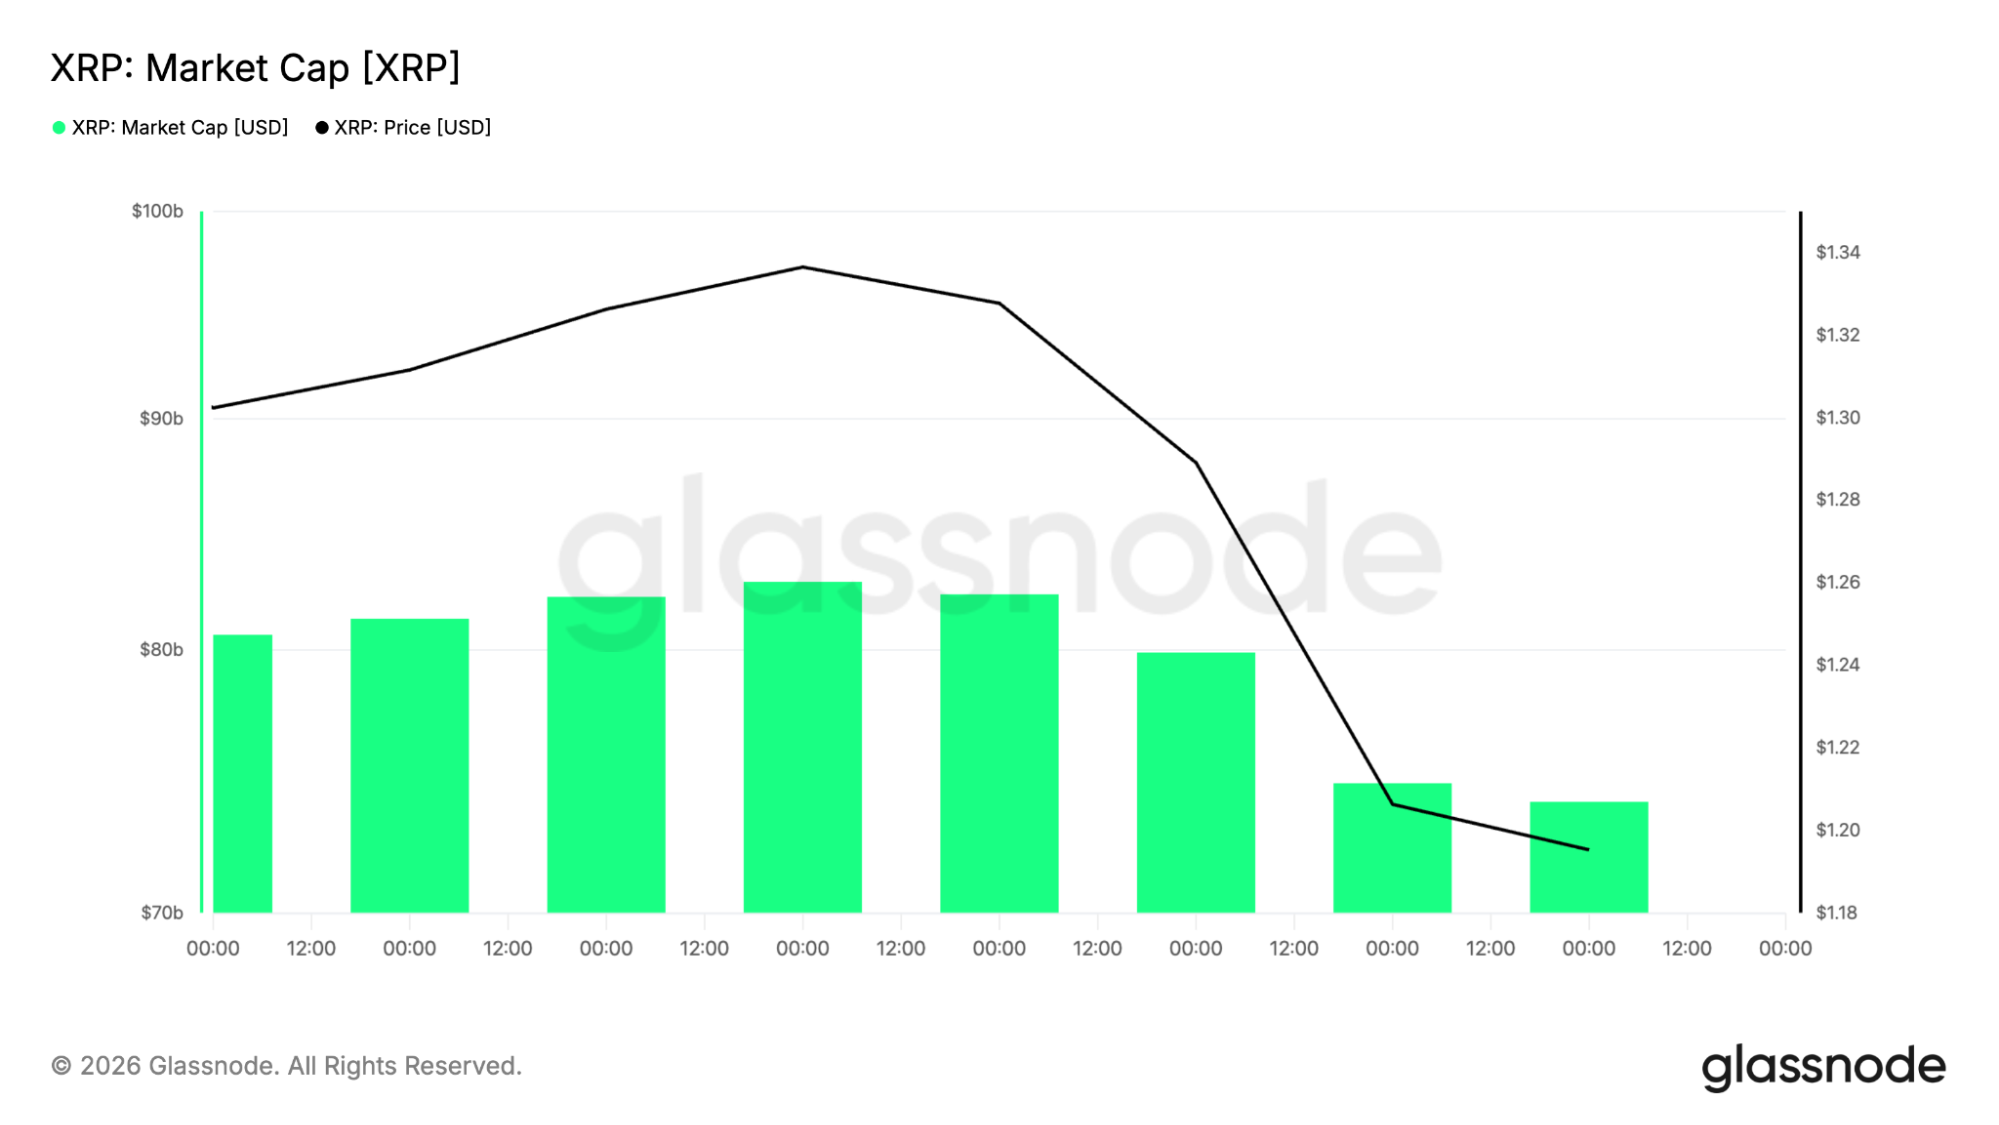
That's a sizable drop and points to capital leaving the asset during the correction. The drawdown data also shows XRP remains well below its previous highs. XRP is still about 67% below its all-time high, hanging in a range between 63% and 67% for months.
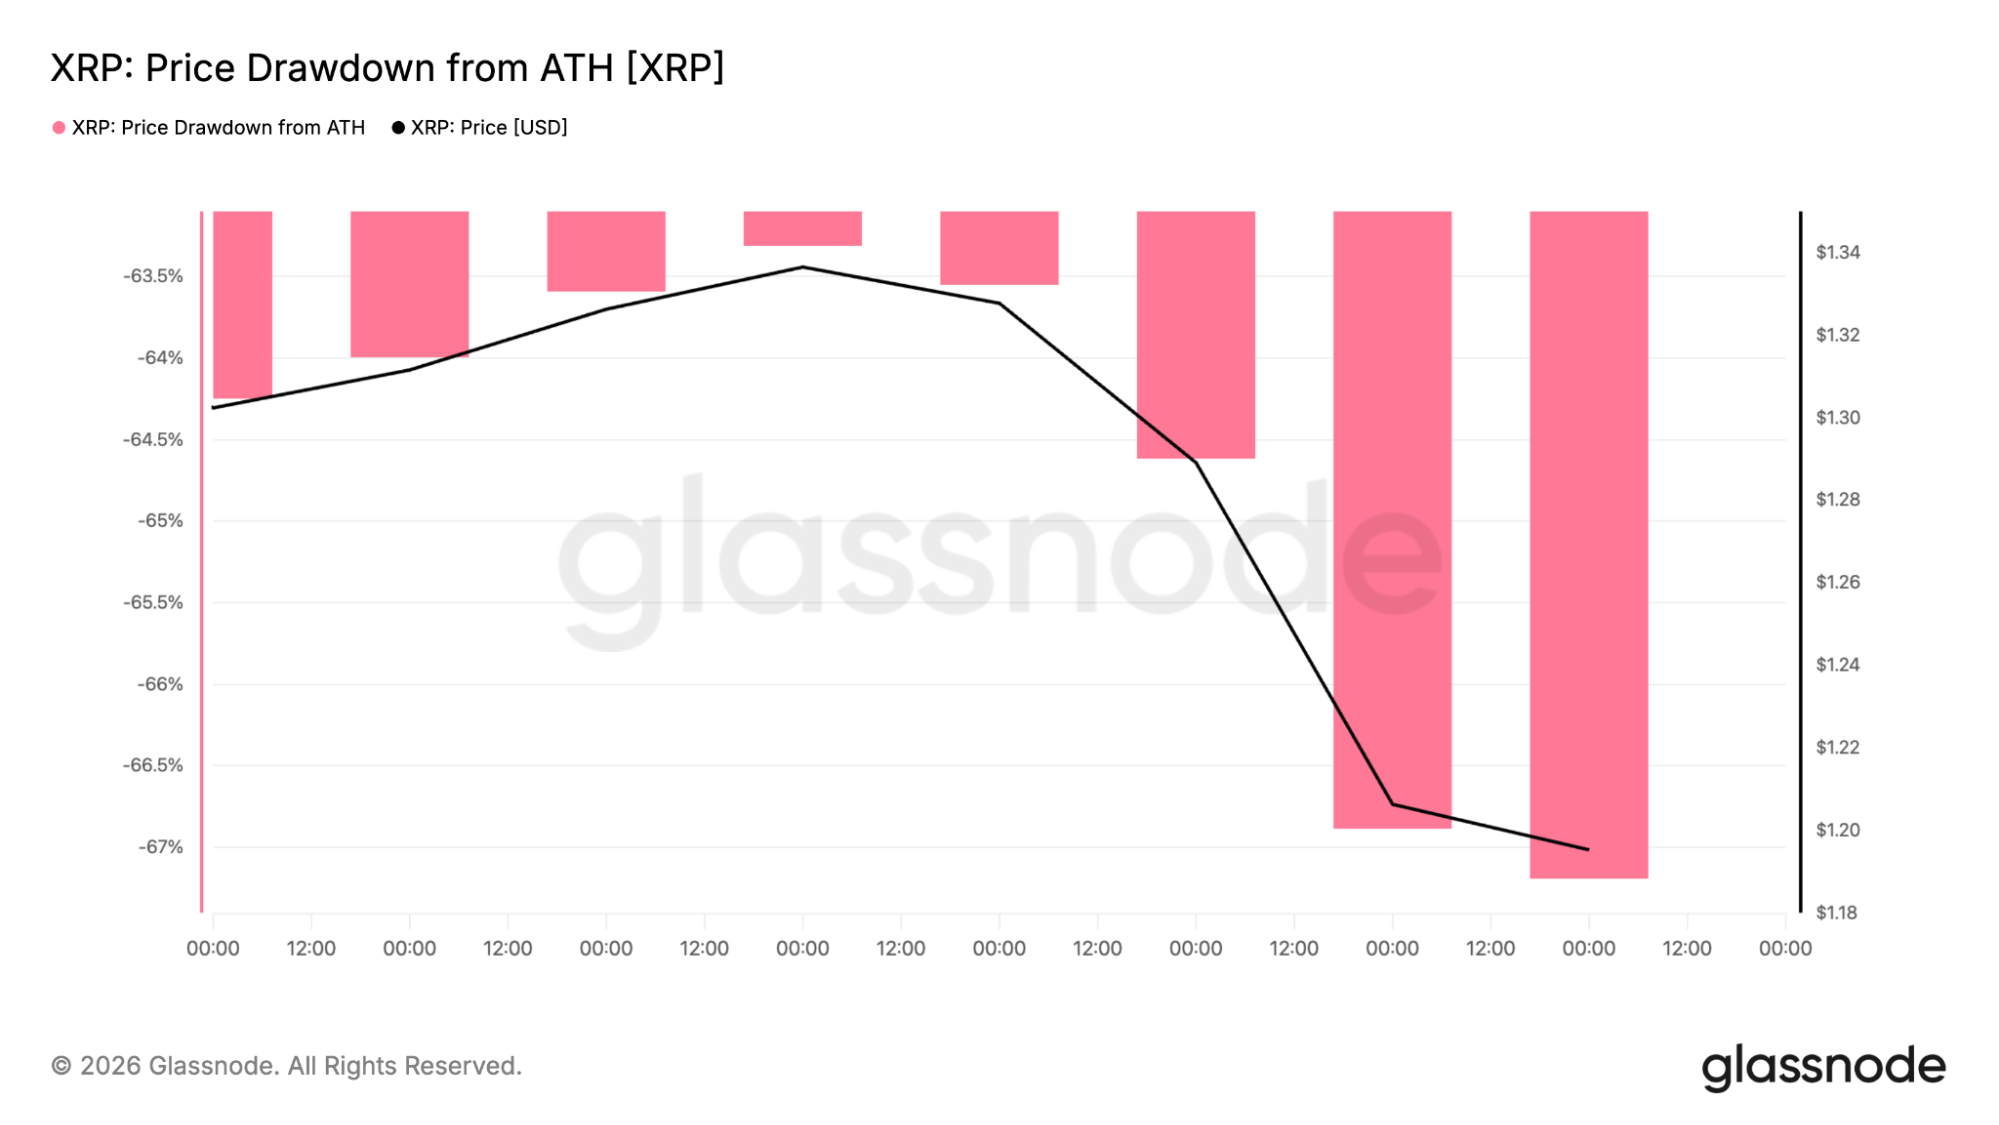
While it hasn't recovered, it's crucial to note that these metrics are weak but steady in identified accumulation zones on Patel's long-term chart. So, while it looks bleak at first glance, there's some stability in those areas.
Regulatory progress could change the narrative
One reason many XRP supporters remain optimistic is the improving regulatory backdrop. The SEC lawsuit officially ended in 2025, establishing that XRP is not considered a security when traded on public exchanges. That removed a major source of uncertainty that had followed the asset for years.
Now that attention has shifted to the CLARITY Act, which passed through the Senate Banking Committee in June 2026, XRP could see some big changes. If it becomes law, it'll provide better guidelines for digital assets, making it easier for institutions to get involved. That's a major boost they're looking forward to.
Outside of regulations, the XRP Ledger keeps improving too. In May 2026, they activated the fixCleanup3_1_3 amendment for better reliability. On top of that, developers are hard at work on new features like protocol-level lending and privacy tools with zero-knowledge proofs.
What happens next for the XRP price?
The XRP price is sitting at an important decision point. The short-term trend remains under pressure after the loss of key moving averages and support levels. At the same time, XRP remains inside a major accumulation zone that many long-term investors have been watching for months.
If buyers continue defending the $1.15–$1.18 area, the next recovery attempt could target $1.30 and eventually the $3.14 level identified by Crypto Patel. If support fails, XRP could revisit the $1.10 region before finding a stronger base.
According to CoinCodex’s 1-month XRP price prediction, XRP could move toward $1.18, which is close to the current trading range and indicates limited price movement over the next month.


Ayrıca Şunları da Beğenebilirsiniz

Palantir Technologies Inc. (PLTR) Stock: Surge as Google Cloud Deal Boosts AI Momentum
Nedbank taps AI-powered lending to reach underserved South Africans

Integra and SettleMint Join Forces for Real Estate Tokenization


Popüler Haberler
Daha fazla
