

Gold Price Forecast: Despite 4 Months of Red, Central Banks are Still Buying
Key highlights:
- Gold hits its longest losing streak since 2022 with three straight monthly declines, even as the uptrend holds.
- Gold stays above the $4,000 breakout zone after an ~18% pullback from highs near $5,600.
- Central bank demand, rising debt, and macro risks keep long-term gold interest strong despite short-term weakness.
Gold has now fallen for three straight monthly candles, with a fourth red month still in play. That marks the longest losing streak gold has seen since 2022, based on Coin Bureau’s monthly chart data.
Even with that pressure, the broader trend hasn’t really broken. The gold price is still around $4,508, which is miles above the 2022 base near $1,620–$1,650. That gap matters when you zoom out and look at the full cycle.
What the Gold price chart is really showing
We had a look at the monthly chart shared by Coin Bureau, and the move into 2025 and 2026 stands out as a fast run-up followed by cooling price action. Gold climbed from about $2,800 in early 2025 to a peak near $5,600, then pulled back toward the $4,500 area.
That pullback is roughly 18%, which actually lines up closely with past corrections. Back in 2022, gold dropped around 18–20% from the $2,000 zone down to about $1,620 before turning higher again.
What’s interesting is that the current gold price is still sitting well above the $4,000 area. That level used to act as resistance in 2024, and now it’s working more like a support zone after the breakout.
Why central banks are still buying gold
Even while the price has been slipping month to month, central banks haven’t slowed down their purchases. Data from Silver Gold News shows central banks have been steady buyers for about three years, picking up as much as a quarter of global supply at times.
China alone has added around 160,000 ounces in March, extending an 18-month streak of continuous buying. That kind of demand isn’t short-term trading. It points to long-term reserve building, especially as central banks continue to diversify away from traditional dollar holdings.
In fact, global reserves now show something unusual: central banks collectively hold more gold than US Treasuries. The US still leads with about 8,134 tonnes, while countries like China, France, Germany, and Italy all sit in the multi-thousand-tonne range.
A few macro forces are still in play here. Rising geopolitical tensions, pressure in energy markets, and inflation concerns are all part of the backdrop supporting demand for gold.
There’s also the debt angle. With global debt above 100% of GDP and government spending still elevated, markets are watching currency stability more closely than before. That’s one reason gold continues to attract long-term interest.
Where the gold price could go next
Even with the recent pullback, the structure of gold still looks tied to a broader uptrend that began back in 2022. After moving from around $1,620 to highs near $5,600, gold is now working through a correction phase rather than a full trend reversal.
Pullbacks toward $4,200–$4,500 would still sit inside previous breakout zones. If pressure builds, $4,000 becomes the crucial level for observation as it has served as an important breakout point before in 2024.
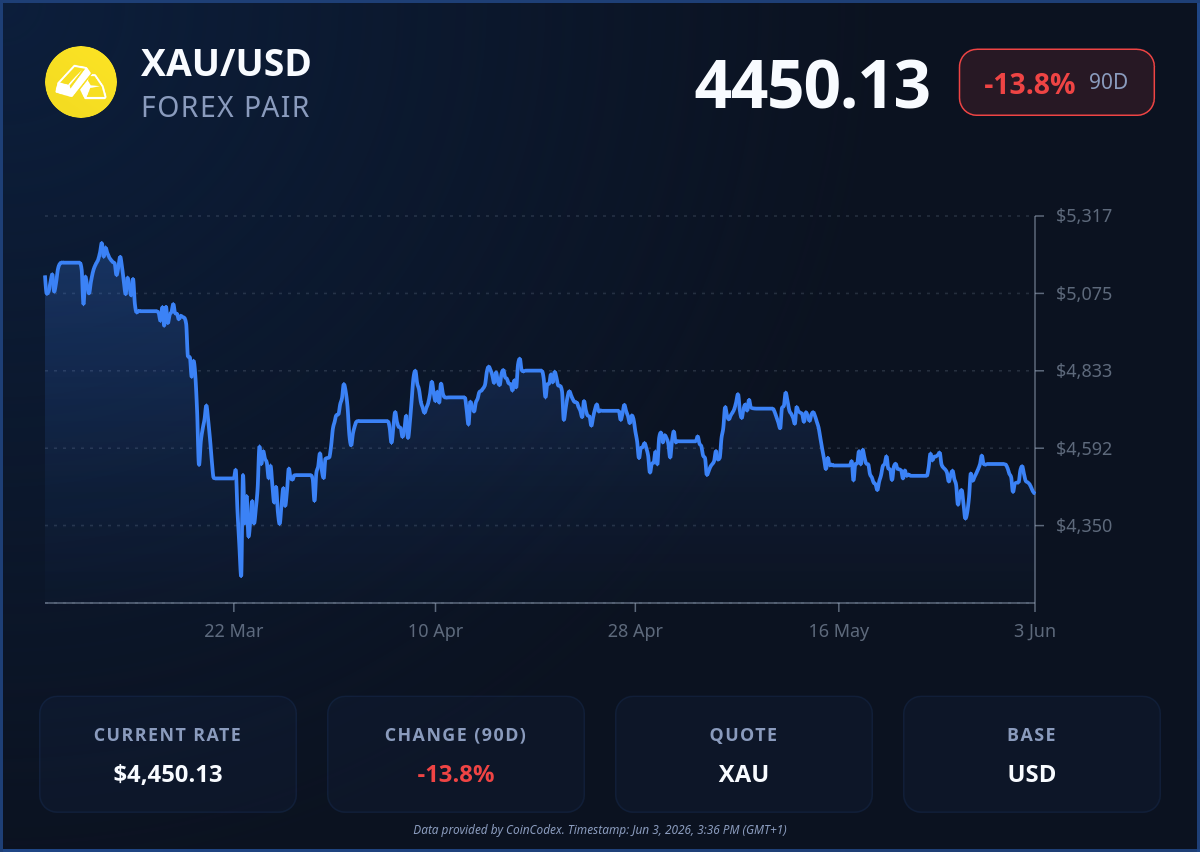
Conversely, a move above recent highs opens up the possibility of rising targets with some long-term targets going even higher towards $6,000 as long as demand from central banks holds up. According to CoinCodex’s 1-month gold price forecast, the gold price could move toward $4,355.09, which sits slightly below the current trading range.


Ayrıca Şunları da Beğenebilirsiniz
Cango Inc. Completes $65M Investment and Secures $10M Convertible Note Financing

Bitcoin (BTC) Reclaims $69K While Mutuum Finance (MUTM) Nears $21M Raised

A group of Trump billionaires just took a shocking loss


Popüler Haberler
Daha fazla
