

Tesla Stock Holds Above Key EMAs Despite Intraday Momentum Pause

Tesla stock holds a constructive stance as June begins, with the daily chart showing a broadly bullish outlook that shorter timeframes have yet to confirm fully. The price closed at $423.74 on June 2, resting comfortably above all three major exponential moving averages (EMAs) on the daily chart. This alignment defines the dominant bias: bulls control the structure despite signs of near-term momentum fatigue.
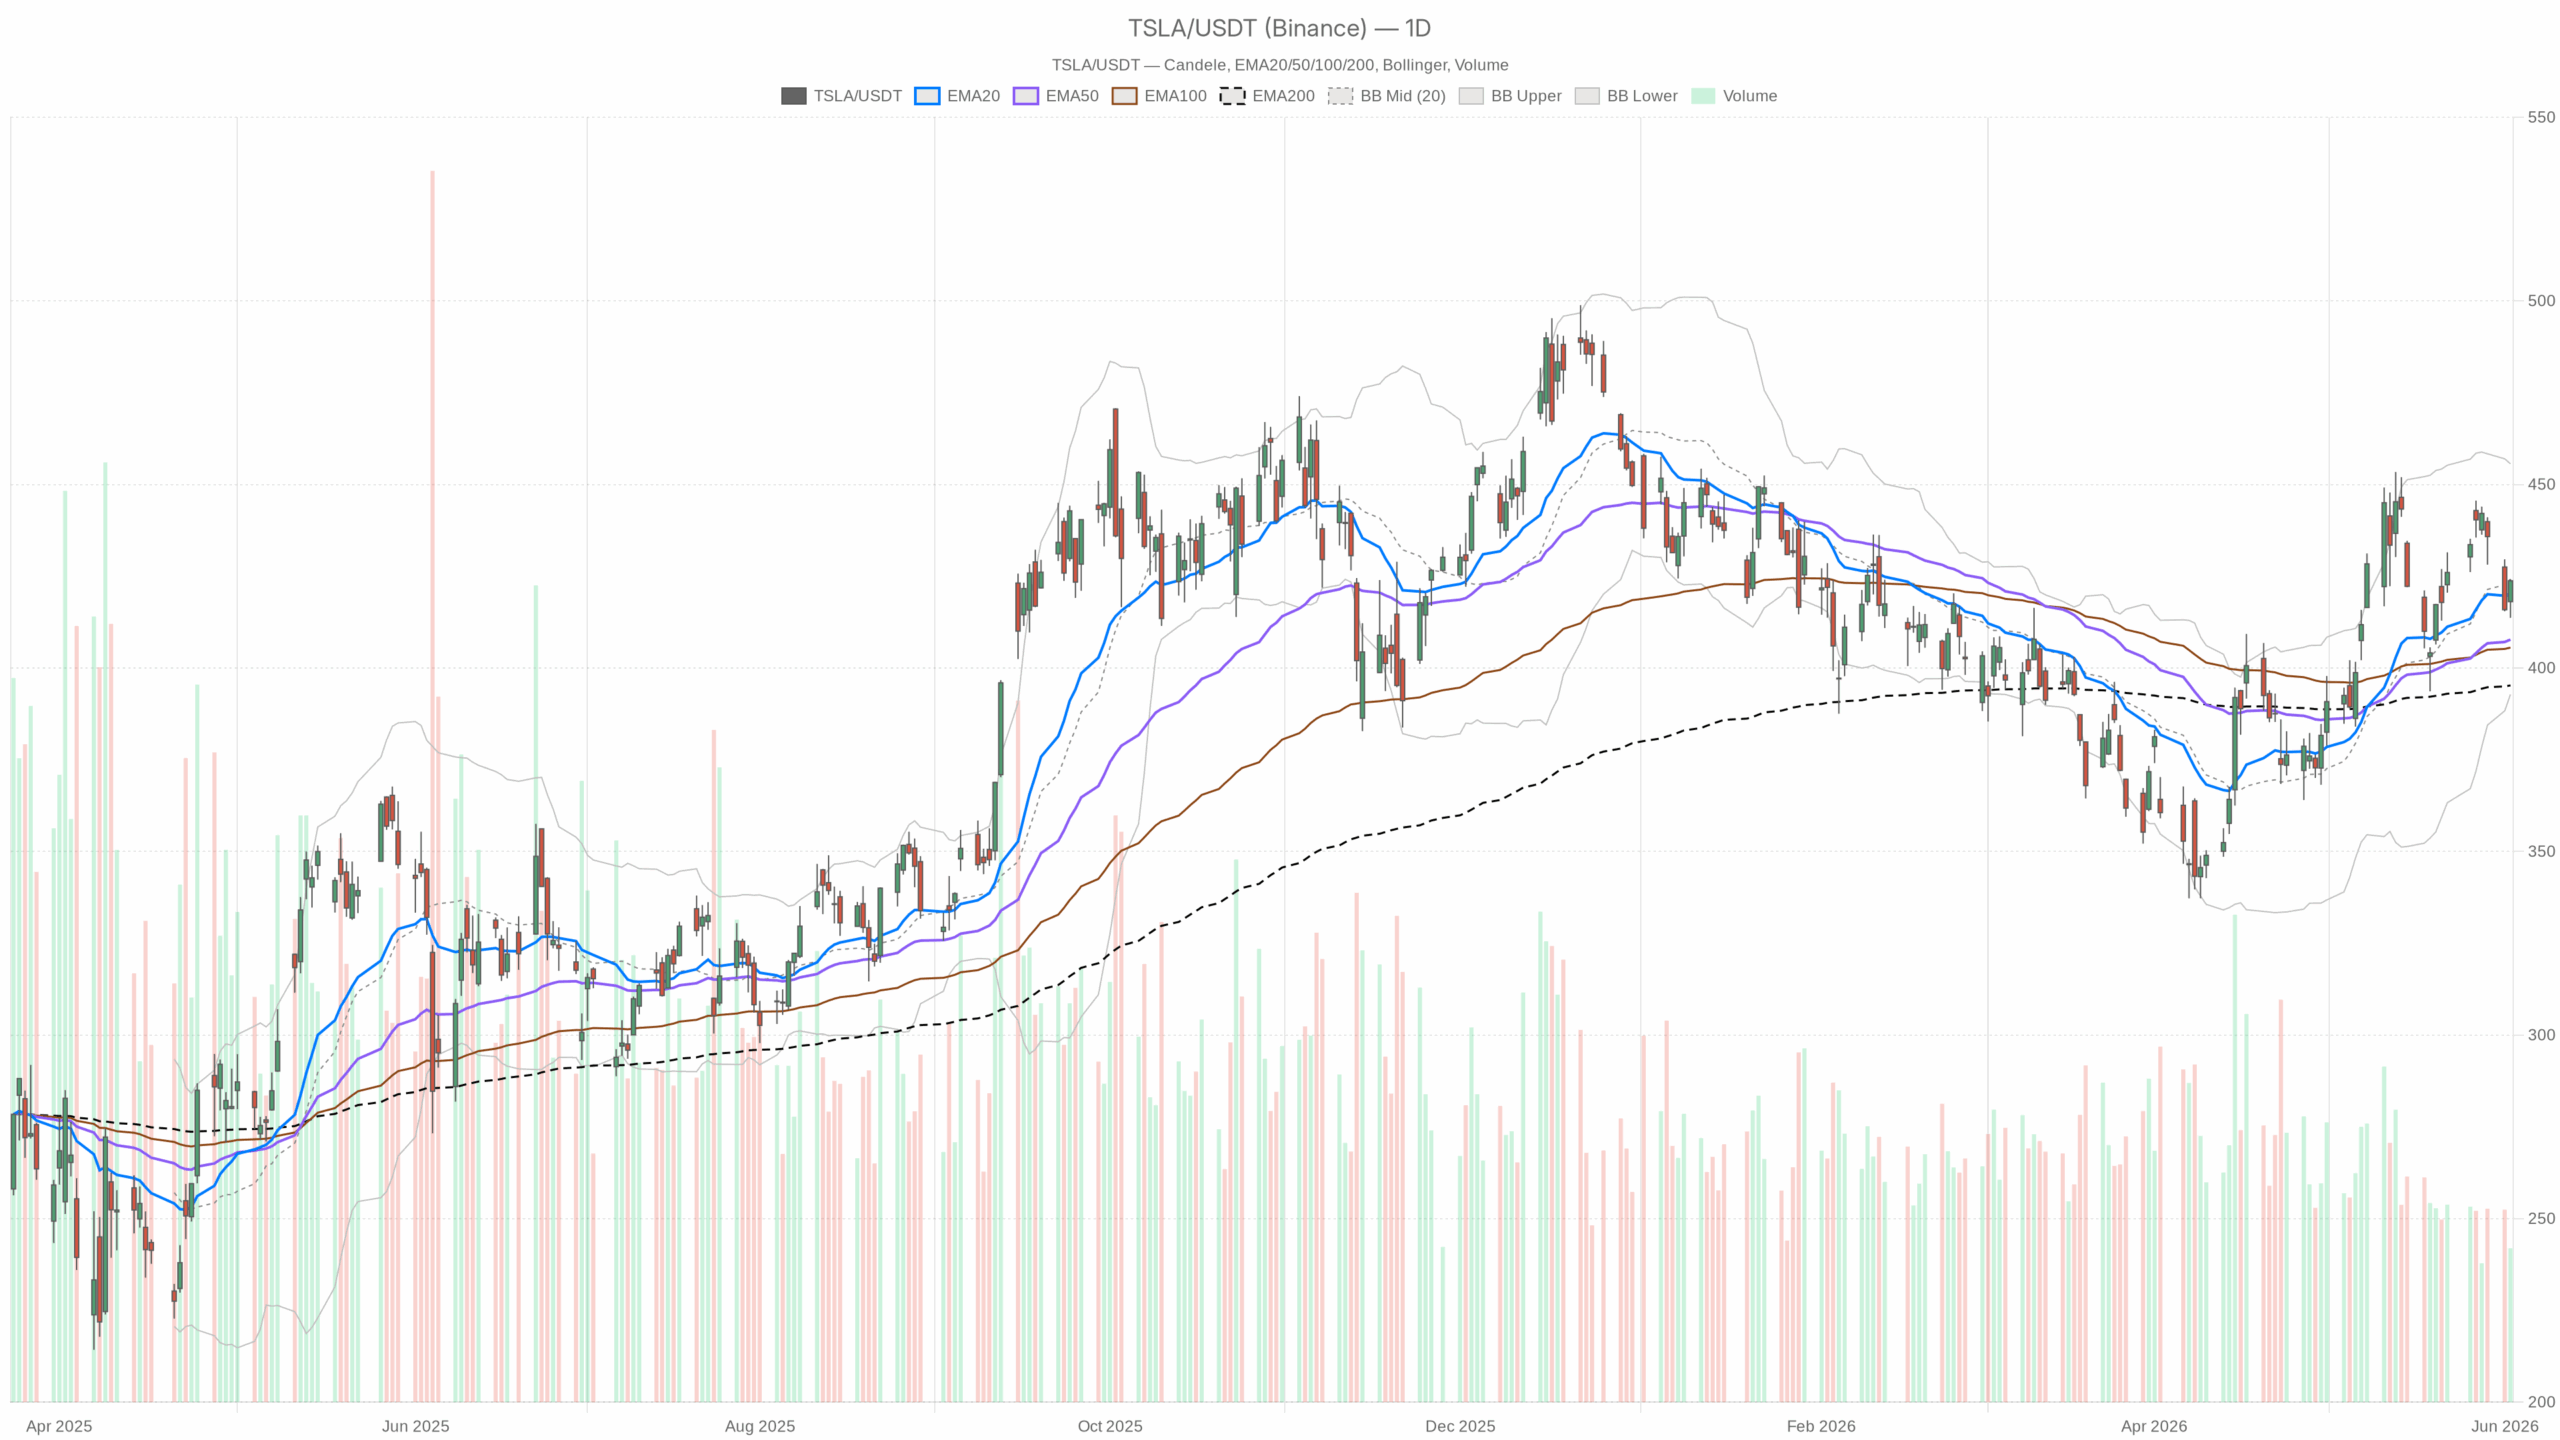 TSLA — daily chart with candlesticks, EMA20/EMA50 and volume.
Daily Chart Overview of Tesla Stock
On the daily timeframe, the EMA stack clarifies the trend. Price trades above the EMA20 at $420.06, EMA50 at $407.73, and EMA200 at $395.25. Each layer signals deeper trend conviction. Closing above all three confirms a bullish regime structurally, not merely speculatively. The daily pivot point at $420.51 further supports this, with resistance at $427.38 and support at $416.88. Closing at $423.74 places TSLA above the pivot and approaching the first resistance (R1) level.
Momentum and Volatility on the Daily Timeframe
However, the daily MACD offers a cautionary signal. The MACD line at 9.32 is below the signal line at 10.78, creating a histogram of -1.45. While this negative reading does not reverse the bullish bias, it signals a slowdown in upside momentum. The recent rally appears to be in digestion rather than reversal, an important nuance for positioning.
The daily RSI reading of 53.59 aligns with a neutral to mild bullish view. It remains well clear of overbought levels and above the 50 midpoint, indicating potential room for gains if new catalysts emerge. Bollinger Bands on the daily chart show a wide range (upper at $455.62, lower at $392.79, mid at $424.21), with the price nearly at the midband. This positioning suggests consolidation after a strong directional move.
The daily Average True Range (ATR) at $14.52 confirms meaningful volatility remains. Intraday swings of this size are typical for TSLA now, and traders should account for this range in risk management rather than viewing it as unusual noise.
Intraday Tesla Stock Trends: Hourly and 15-Minute Perspectives
Hourly Chart Analysis Reveals Short-Term Hesitation
On the hourly chart, the trend appears more uncertain. The 1-hour regime is neutral, supported by indicator readings. Price at $423.74 trades below the EMA20 ($424.72) and EMA50 ($426.96), indicating a bearish short-term EMA setup that contrasts the daily bullish structure. However, price remains above the 1-hour EMA200 at $413.66, which serves as broader trend support. This split suggests that the intraday trend correction is occurring within a larger uptrend rather than signaling bearish dominance.
The 1-hour MACD remains negative but shows a slight positive histogram at 0.04, implying that selling pressure is stabilizing. Meanwhile, the 1-hour RSI at 46.07 is below 50, indicating mild bearishness consistent with a corrective phase. The 1-hour pivot at $422.58, with support at $421.00 and resistance at $425.31, defines a tight zone where the next directional move will likely form.
15-Minute Chart: Short-Term Bullish Signals
The 15-minute chart offers a more optimistic short-term outlook. The RSI at 59.16 shows growing upside momentum. The MACD histogram is positive at 0.18, with the MACD line crossing above its signal line, signaling renewed micro-level strength. Price trades above the EMA20 ($421.73) and EMA50 ($423.17) but still faces resistance near the EMA200 at $426.94. Tight Bollinger Bands range from $420.48 to $423.33, indicating low short-term volatility. A decisive break above $423.33 on this timeframe would signal a fresh push of upside momentum.
Fundamental and Market Sentiment Factors Affecting Tesla Stock
The fundamental backdrop for Tesla remains complex. The May rally largely reflected optimism about the robotaxi rollout. However, regulatory challenges have emerged, notably Texas Senate Bill 2807, which imposes stricter Level 4/5 autonomous vehicle regulations. This bill could delay Tesla’s robotaxi timeline in a key market, creating meaningful downside risk for one of the primary bullish catalysts.
Additionally, the SpaceX IPO casts a shadow over TSLA. Investor Gary Black has identified SpaceX’s upcoming listing as a potential capital rotation driver, leading some investors to sell Tesla shares to fund SpaceX participation. Conversely, retail speculation around a possible Tesla-SpaceX merger has surfaced, suggesting a merger could add up to $450 billion to Tesla’s valuation. While speculative, such narratives influence sentiment-driven flows in Tesla’s retail-heavy ownership base.
Scenarios for Tesla Stock Movement
Bullish Case
The bullish scenario depends on the daily structure holding firm. If TSLA breaks and holds above the 1-hour EMA50 at $426.96 and the daily MACD histogram turns positive again, the path toward the daily Bollinger upper band at $455.62 reopens. Progress on robotaxi regulations—especially toward a resolution for Texas SB 2807—would strengthen this technical setup. Sustained closes above the daily R1 resistance at $427.38 would confirm the next leg higher.
Bearish Case
The bearish scenario is more catalyst-driven than structural. Failure to maintain the daily EMA20 at $420.06 would sharply shift near-term bias lower, putting the daily S1 support at $416.88 in focus. Below that level, the EMA50 at $407.73 is the next key support. Any worsening in the robotaxi narrative or regulatory setbacks could accelerate the fundamental weakening beyond technical signals, increasing the risk of a pronounced pullback. Heightened capital rotation toward SpaceX could add additional selling pressure that is tough to predict.
Conclusion: Tesla Stock at a Technical and Fundamental Crossroads
Overall, Tesla stock is positioned at a critical inflection. The daily chart maintains a bullish bias supported by clear EMA alignment and price above key trend markers. However, hourly indicators reveal near-term uncertainty. The immediate trading range between $420 and $427 is pivotal. Given elevated daily volatility and conflicting narratives—robotaxi optimism versus regulatory risks and SpaceX capital flows—price action is unlikely to settle quietly. Traders should adopt disciplined positioning with strict stop-loss logic near daily supports to manage risk effectively in this environment.


Ayrıca Şunları da Beğenebilirsiniz

Solana price confirms bearish crossover following Drift exploit, will it crash?

Canadian Dollar Holds Ground Against US Dollar as Resistance Caps Losses: Scotiabank

Ionics, Inc. to hold Annual Stockholders’s Meeting on June 26 via remote communication


Popüler Haberler
Daha fazla
