

Ethereum (ETH) Crashes Below $2,000 Amid Weakening Institutional Demand
Key Takeaways
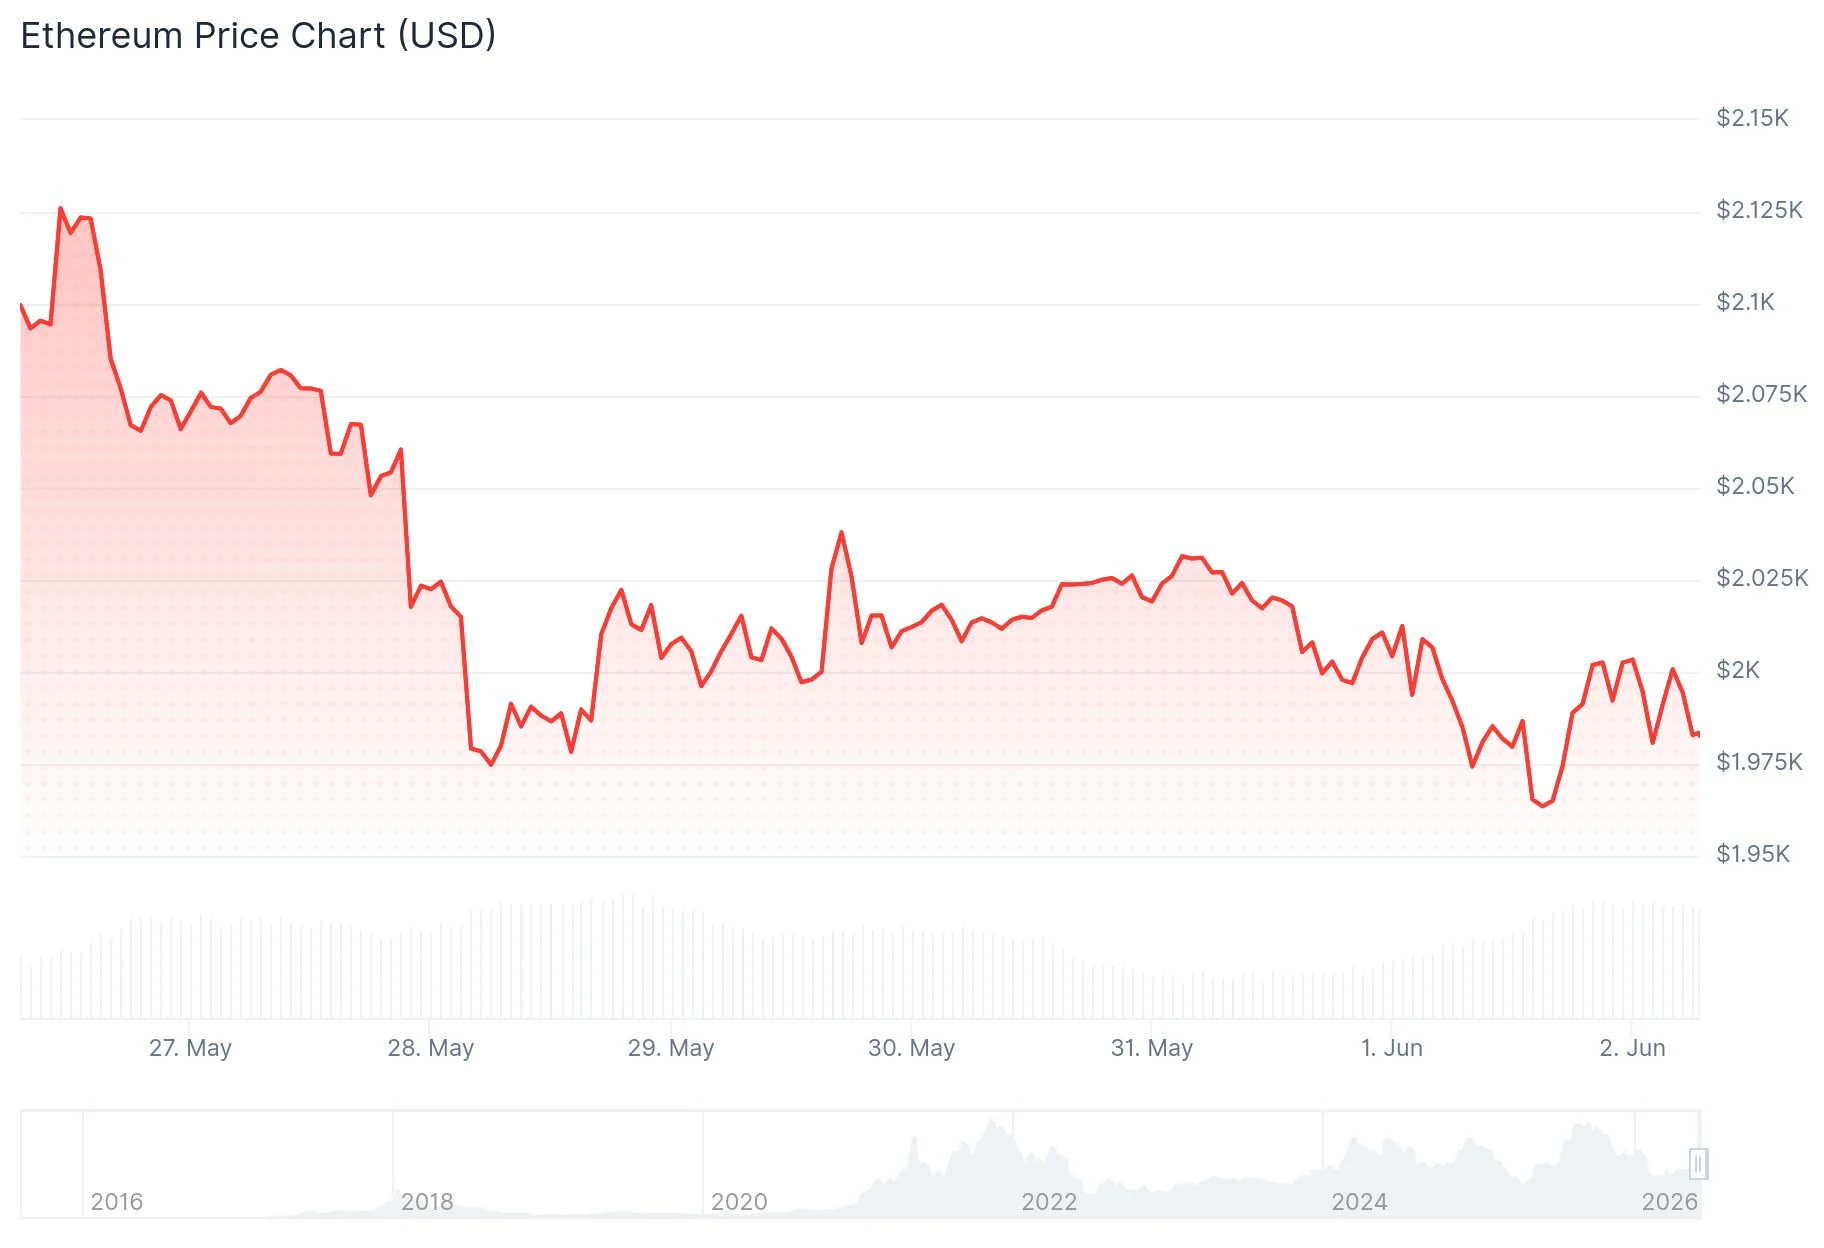
- Ethereum breached the $2,000 threshold, reaching an intraday bottom at $1,955
- BitMine acquired just 26,497 ETH during the previous week — marking its third-smallest weekly accumulation since implementing its Ethereum treasury approach
- BitMine currently holds an unrealized loss of approximately $9 billion on its ETH position
- Spot Ethereum ETFs in the United States experienced their third consecutive week of negative flows
- Critical price floor established at $1,909; failure to hold could trigger a decline toward $1,741
Ethereum has slipped beneath the psychologically important $2,000 mark following renewed bearish momentum that drove the asset to an intraday bottom of $1,955. The digital asset continues to face difficulty maintaining positive price action as sellers dominate across various time horizons.
 Ethereum (ETH) Price
BitMine Immersion Technologies (BMNR) accumulated 26,497 ETH during the prior week, elevating its aggregate position to 5.41 million ETH, currently valued at approximately $10.72 billion. This weekly acquisition represents the firm’s third-smallest purchase volume since adopting its Ethereum-focused treasury approach in 2025.
According to BitMine’s Chairman Thomas Lee, the corporation is deliberately reducing its acquisition velocity due to already surpassing its scheduled timeline for acquiring 5% of Ethereum’s total circulating supply. Lee further noted that present market valuations fail to accurately represent Ethereum’s strengthening fundamental outlook.
Neverthstanding this optimistic view, the company’s entire ETH holdings currently sit in negative territory with unrealized losses totaling roughly $9 billion, according to analytics from CryptoQuant.
Market analyst Rekt Capital highlighted on X that Ethereum has now recorded monthly closes beneath its long-term ascending trendline twice within a five-month span. He cautioned that bounce attempts from this critical trendline are displaying diminishing strength, emphasizing that ETH must preserve its 2026 low points or successfully recapture the trendline to prevent further downward movement.
Continued Institutional Withdrawals Apply Downward Force
Spot Ethereum exchange-traded funds in the United States have registered negative net flows for three consecutive weeks, according to data from SoSoValue. This pattern indicates persistent hesitation among institutional market participants.
Strategy, which maintains the largest cryptocurrency treasury by total holdings, revealed it liquidated 32 BTC during the previous week for $2.5 million to finance preferred stock dividend obligations. This transaction contributes to the wider narrative of digital asset corporate treasuries experiencing financial strain.
Ethereum witnessed $106.3 million in forced liquidations throughout the preceding 24-hour period. Bullish positions represented $90.3 million of that aggregate figure, according to data compiled by Coinglass.
Critical Support and Resistance Zones
Examining the daily timeframe, Ethereum is positioned beneath its 20-, 50-, and 100-day exponential moving averages at $2,098, $2,172, and $2,269 respectively. This configuration, with all three primary moving averages situated above current trading levels, traditionally indicates bearish market structure.
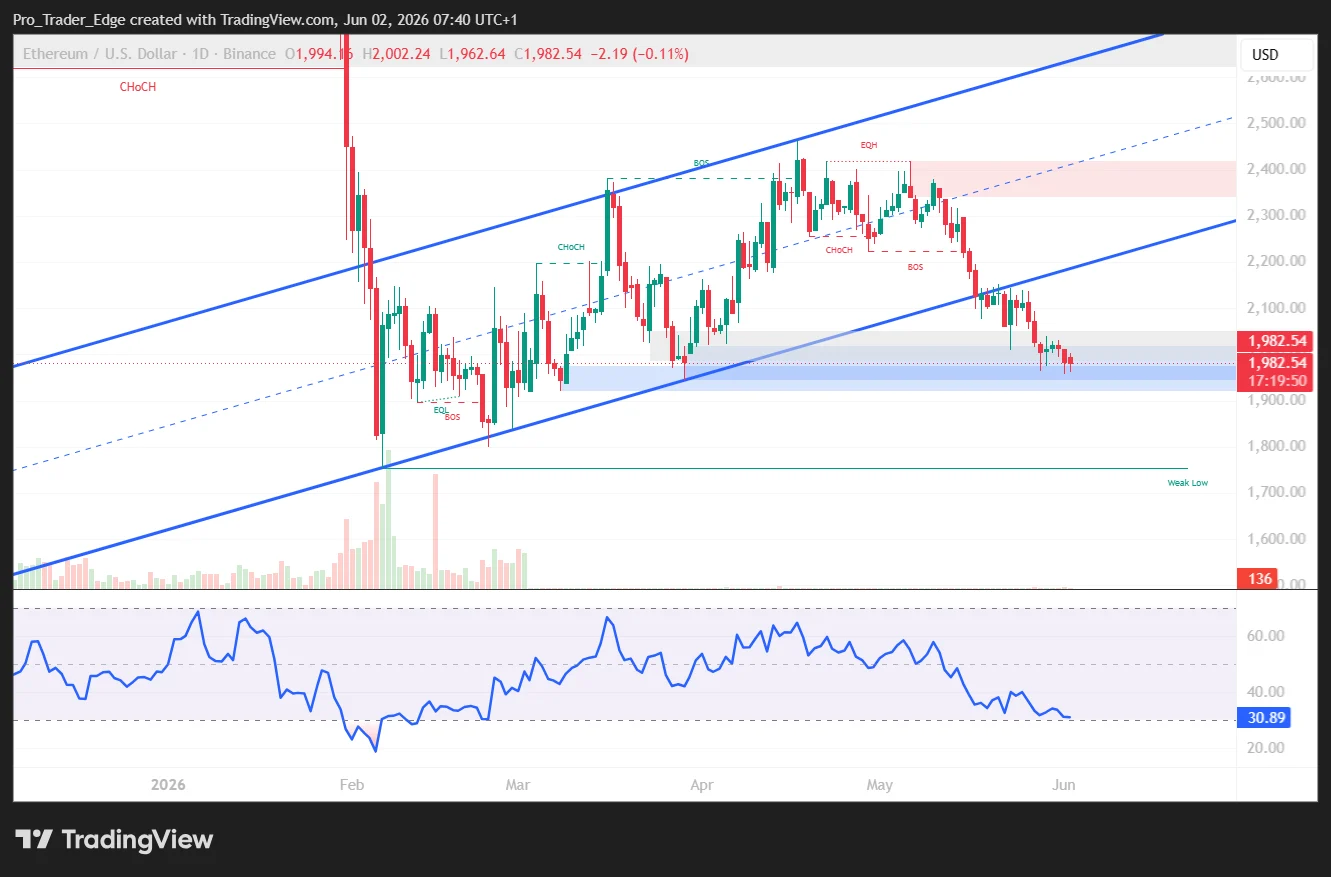 Source: TradingView
The 14-period Relative Strength Index is positioned near the 30 threshold while the Stochastic Oscillator has descended into deeply oversold ranges. Although these readings confirm substantial selling momentum, they don’t necessarily indicate an imminent trend reversal.
Regarding upside obstacles, immediate resistance barriers are located at $2,000, $2,020, $2,050, and $2,080. Successfully breaching $2,050 could pave the way toward testing $2,120 or potentially $2,150.
For downside scenarios, the initial support zone rests at $1,955, with subsequent floors at $1,920 and $1,909. Should the price penetrate below $1,909, it would leave $1,741 vulnerable, with additional support structures at $1,524 and $1,404 if bearish pressure intensifies.
ETH was most recently changing hands around $1,980, positioned below the 100-hour Simple Moving Average, while a descending trendline resistance has formed near $2,010 on the hourly timeframe.
The post Ethereum (ETH) Crashes Below $2,000 Amid Weakening Institutional Demand appeared first on Blockonomi.


Ayrıca Şunları da Beğenebilirsiniz
NEAR Protocol (NEAR) Surges 20% Against Market Downturn — Can It Reach $3.77?

Bloomberg Odd Lots Host Calls This the Coldest Crypto Winter Ever — And It’s Not Just Bearish Noise

Amazon (AMZN) Stock; Drops After June Prime Day Announcement


Popüler Haberler
Daha fazla
