Bitcoin (BTC) price today remains under pressure after entering a deeper correction, with traders closely monitoring whether the market is approaching a major long-term support zone.
After briefly falling below $60,000, BTC rebounded to around $63,800 as short liquidations triggered forced buying. Based on historical analysis, BTC price can see more downside in the coming days
The recent breakdown below a multi-month ascending channel has shifted market focus from upside targets to key support levels that could determine the next phase of the cycle.
Will Bitcoin Price Drop More?
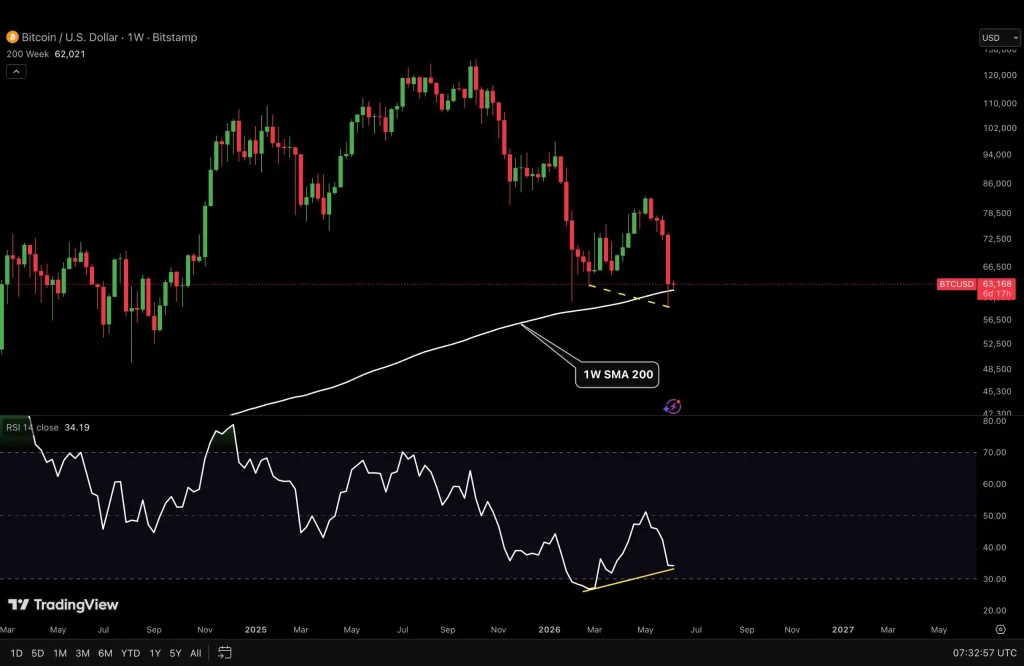
One of the most important levels on the Bitcoin chart is the weekly 200 Moving Average (MA), currently positioned near $59,100.
Historically, Bitcoin has found support around the weekly 200 MA during major bear markets and deep corrections before beginning long-term recoveries. This level is viewed as a major test for the market structure.
- Holding above $59,100 could signal that long-term buyers remain active.
- A sustained break below this level could increase the probability of a move toward lower support zones.
Also Read: Bitcoin (BTC) Price Prediction 2026, 2027 – 2030: How High Will BTC Price Go?
Bitcoin ETF Outflows and Whale Selling Remain Key Risks
Selling pressure remains an important factor for traders.
Recent market data shows:
- Record monthly ETF outflows
- Large holders sold approximately 24,602 BTC during May
- Volume remains heavily skewed toward sellers
These factors suggest the correction may not be fully complete.
Bitcoin Bear Market Comparison: Similarities to 2022
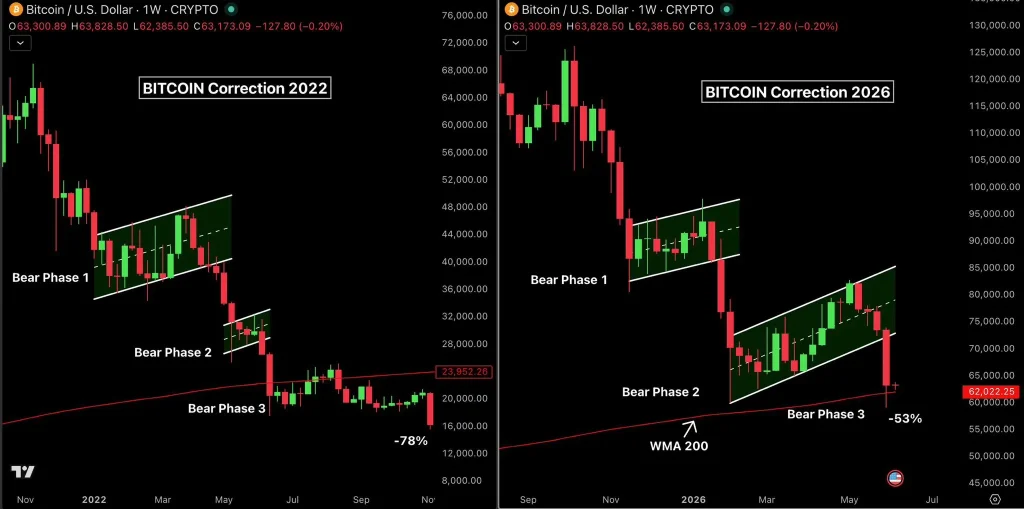
Analyst Ash Crypto has compared the current correction to the 2022 bear market.
During the 2022 cycle, Bitcoin fell approximately 78% from its peak before establishing a bottom. The current decline stands at roughly 53% from the cycle high, suggesting that previous bear market drawdowns were significantly deeper.
While historical performance does not guarantee future results, the comparison explains why some traders remain cautious despite the recent rebound.
BTC Realized Price Suggests Further Downside Remains Possible
On-chain data shows Bitcoin’s realized price near $53,600.
Historically, previous cycle bottoms formed between 34% and 58% below the realized price. Based on that historical relationship, some analysts argue Bitcoin could still revisit lower levels between approximately $37,000 and $50,000 before establishing a final bottom.
How Low Can Bitcoin Price Go?
According to analyst Rekt Fencer, he, too, believes BTC price is mirroring the 2022 structure, suggesting a potential sharp decline if history repeats. He predicts BTC could fall to $55,000 within the next two weeks under one scenario, while a deeper correction could see prices reach $48,000 by July.
The key support levels are being closely watched as Bitcoin searches for a potential bottom.
- $55,000 is the first major support level below current prices. This area previously acted as a strong demand zone and could attract buyers if selling pressure continues.
- $50,000 is the next important support level. Besides being a major psychological milestone, it is also a level where traders expect increased buying interest.
- $44,000-$52,000 is considered the strongest potential bottoming zone by many analysts. This range is supported by multiple technical indicators, including:
- The 50% Fibonacci retracement of the 2022-2025 bull cycle.
- A major accumulation area formed during 2024.
- Long-term power law trend projections.
- Multiple technical models point to the same support range.
Based on current technical and on-chain models, the most widely watched downside targets are $55,000, $50,000, and the broader $44,000-$52,000 accumulation zone, with some bearish projections extending toward $37,000 under a deeper correction scenario.