After briefly approaching $117,000 earlier this week, the leading cryptocurrency faced rejection at that zone and is now trading near […] The post Bitcoin’s Next Move: Support at $114K or Deeper Correction? appeared first on Coindoo.After briefly approaching $117,000 earlier this week, the leading cryptocurrency faced rejection at that zone and is now trading near […] The post Bitcoin’s Next Move: Support at $114K or Deeper Correction? appeared first on Coindoo.

Bitcoin’s Next Move: Support at $114K or Deeper Correction?

2025/09/25 00:55

After briefly approaching $117,000 earlier this week, the leading cryptocurrency faced rejection at that zone and is now trading near $113,200.

Market analyst Rekt Capital noted that the $117,200 level is proving to be a major resistance point. He added that the next test for Bitcoin will be whether it can hold $114,000 as support. If confirmed, the recent rejection may be seen as relatively shallow, potentially allowing for another push higher.

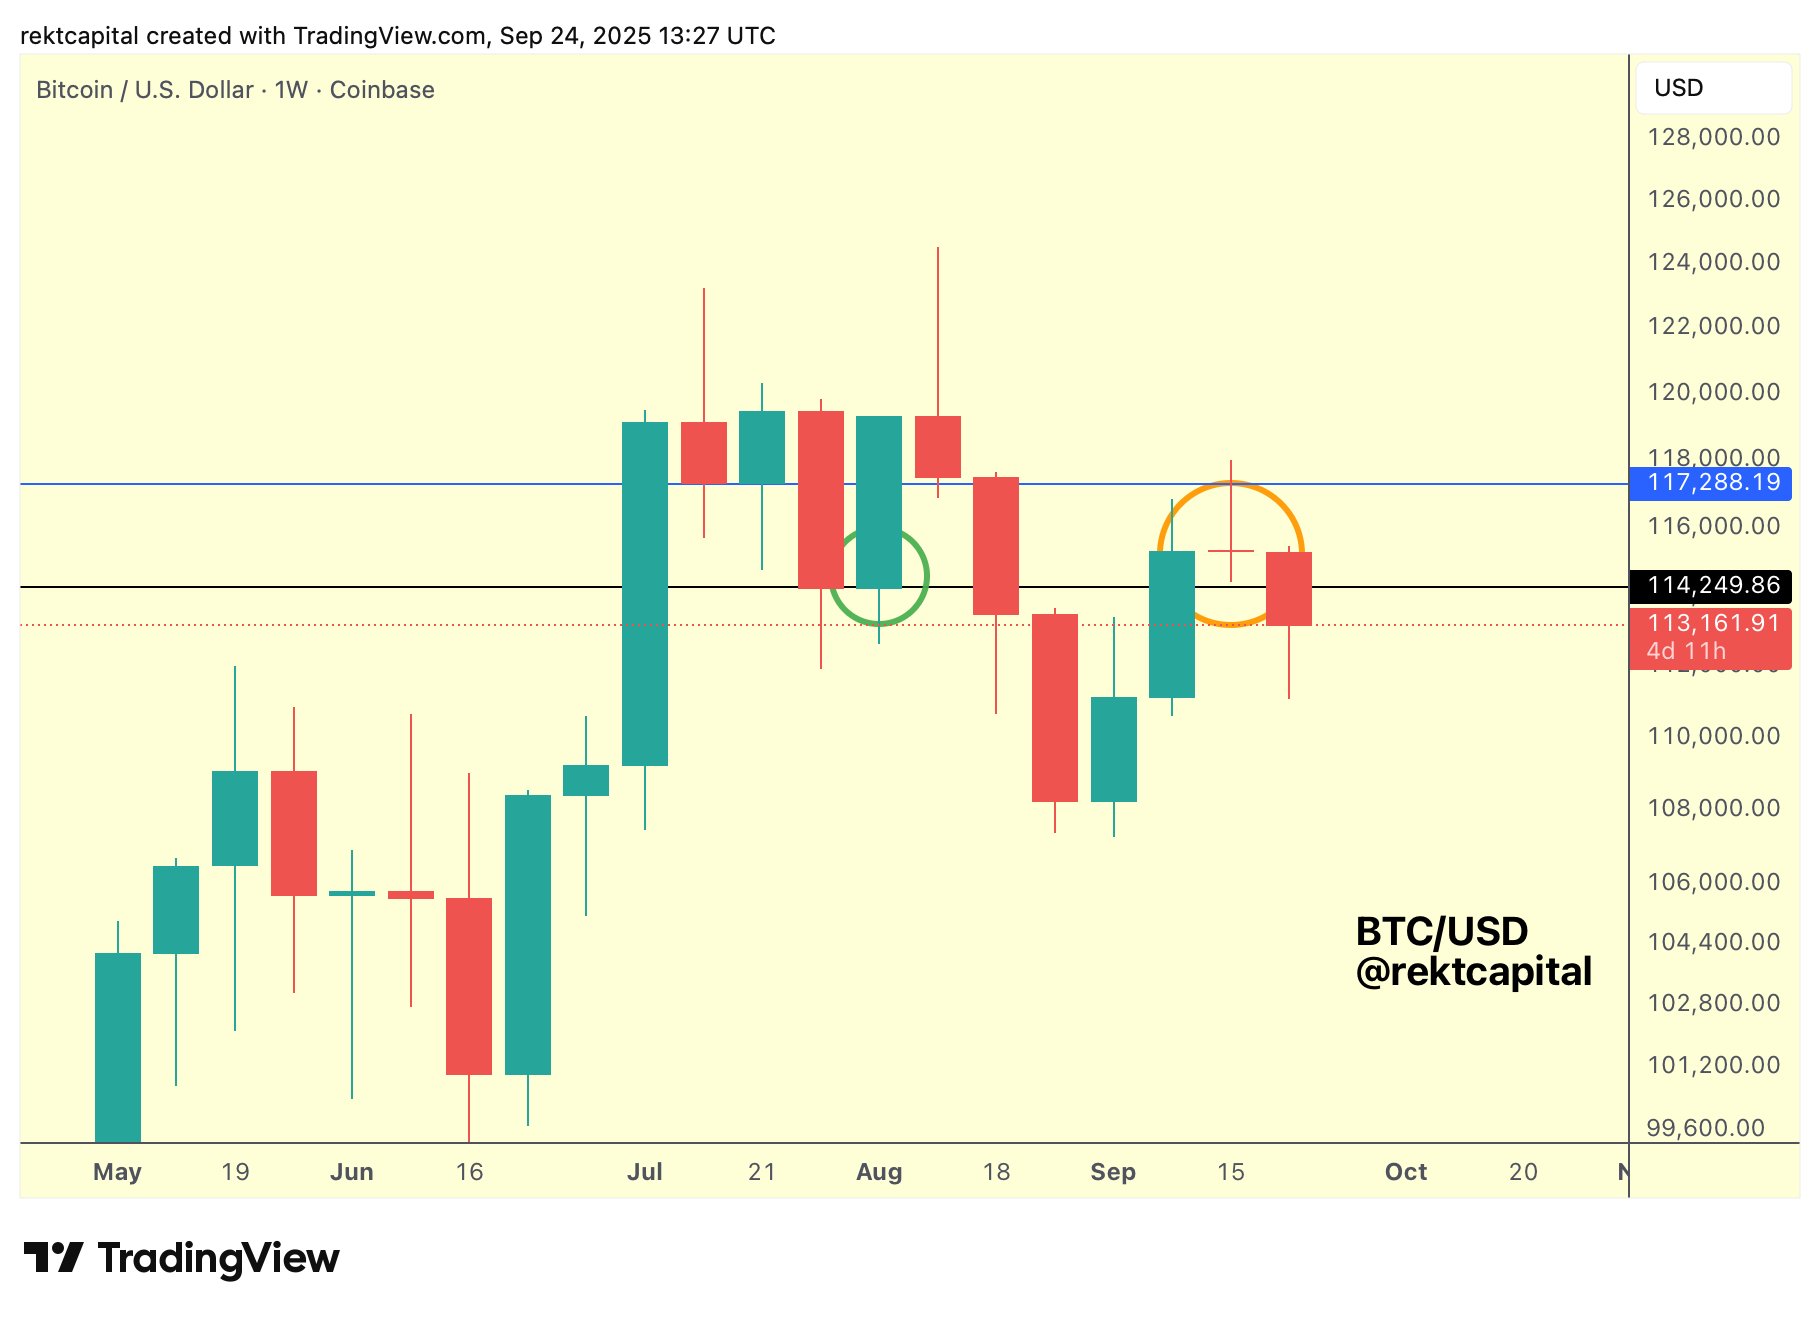
The daily Relative Strength Index (RSI) remains neutral around 55, suggesting neither overbought nor oversold conditions. This reflects market indecision as Bitcoin consolidates after a volatile September marked by rapid swings between $112,000 and $120,000.

Meanwhile, fresh data highlights a divergence between Bitcoin and traditional markets. According to Crypto Rover, correlations with gold and Nasdaq stocks have recently weakened.

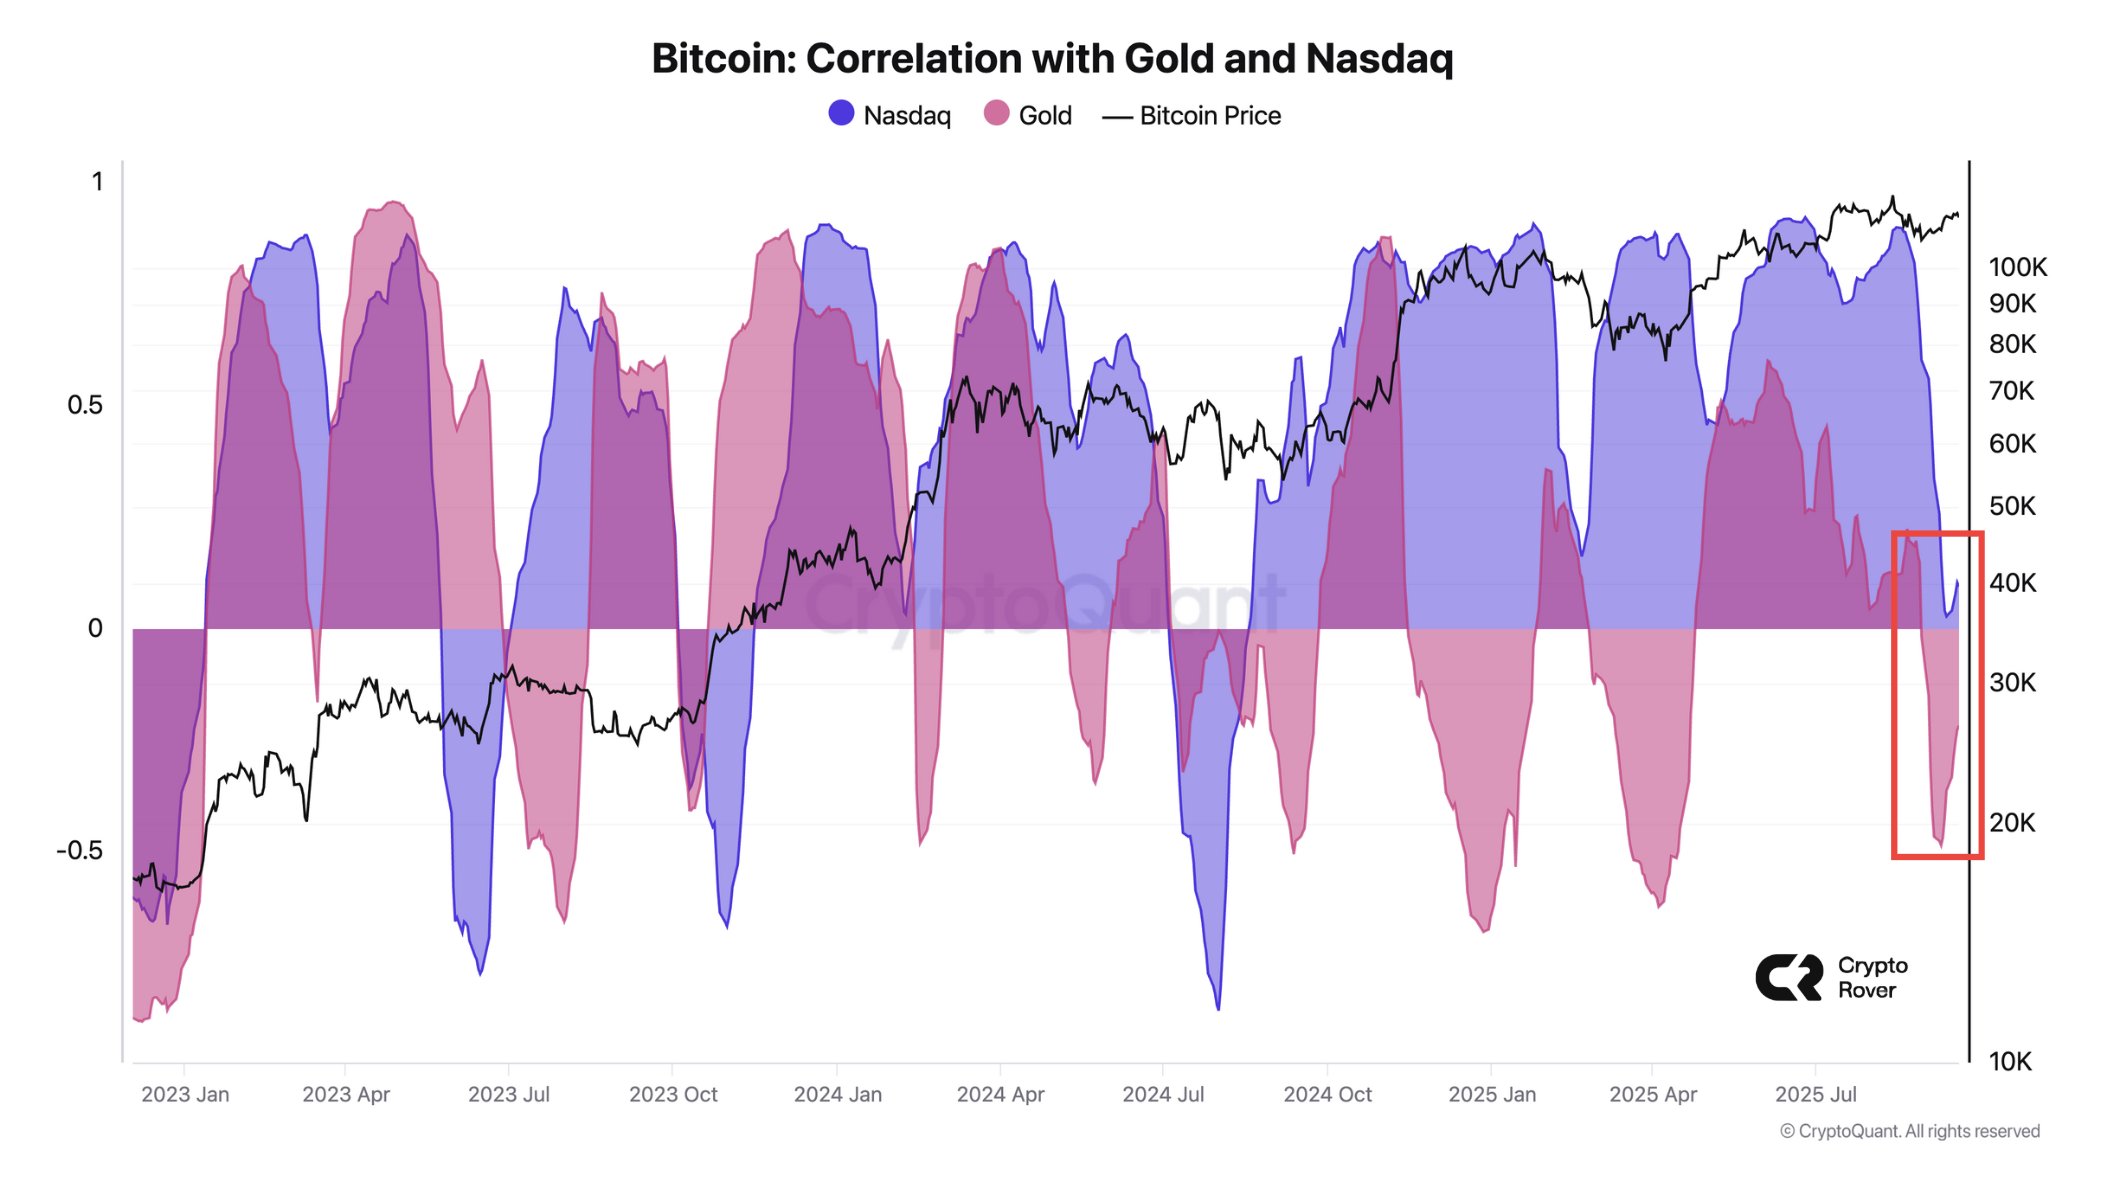
Historically, such breaks in correlation often precede sharp price moves as Bitcoin reasserts itself as a distinct asset class.

READ MORE:

Bitcoin Price: 3 Bearish Signals Point to Deeper Drop

Despite the pullback from $117K, Bitcoin remains well above its May lows near $110,000, which has served as strong support throughout the summer. Traders now look for confirmation at $114K to gauge whether this rejection is temporary or the beginning of deeper retracement.

With October historically one of Bitcoin’s stronger months, analysts caution that the coming weeks may prove decisive in shaping the next leg of the trend.


The information provided in this article is for educational purposes only and does not constitute financial, investment, or trading advice. Coindoo.com does not endorse or recommend any specific investment strategy or cryptocurrency. Always conduct your own research and consult with a licensed financial advisor before making any investment decisions.

The post Bitcoin’s Next Move: Support at $114K or Deeper Correction? appeared first on Coindoo.

Disclaimer: The articles reposted on this site are sourced from public platforms and are provided for informational purposes only. They do not necessarily reflect the views of MEXC. All rights remain with the original authors. If you believe any content infringes on third-party rights, please contact service@support.mexc.com for removal. MEXC makes no guarantees regarding the accuracy, completeness, or timeliness of the content and is not responsible for any actions taken based on the information provided. The content does not constitute financial, legal, or other professional advice, nor should it be considered a recommendation or endorsement by MEXC.

You May Also Like

Microsoft Corp. $MSFT blue box area offers a buying opportunity

Microsoft Corp. $MSFT blue box area offers a buying opportunity

The post Microsoft Corp. $MSFT blue box area offers a buying opportunity appeared on BitcoinEthereumNews.com. In today’s article, we’ll examine the recent performance of Microsoft Corp. ($MSFT) through the lens of Elliott Wave Theory. We’ll review how the rally from the April 07, 2025 low unfolded as a 5-wave impulse followed by a 3-swing correction (ABC) and discuss our forecast for the next move. Let’s dive into the structure and expectations for this stock. Five wave impulse structure + ABC + WXY correction $MSFT 8H Elliott Wave chart 9.04.2025 In the 8-hour Elliott Wave count from Sep 04, 2025, we saw that $MSFT completed a 5-wave impulsive cycle at red III. As expected, this initial wave prompted a pullback. We anticipated this pullback to unfold in 3 swings and find buyers in the equal legs area between $497.02 and $471.06 This setup aligns with a typical Elliott Wave correction pattern (ABC), in which the market pauses briefly before resuming its primary trend. $MSFT 8H Elliott Wave chart 7.14.2025 The update, 10 days later, shows the stock finding support from the equal legs area as predicted allowing traders to get risk free. The stock is expected to bounce towards 525 – 532 before deciding if the bounce is a connector or the next leg higher. A break into new ATHs will confirm the latter and can see it trade higher towards 570 – 593 area. Until then, traders should get risk free and protect their capital in case of a WXY double correction. Conclusion In conclusion, our Elliott Wave analysis of Microsoft Corp. ($MSFT) suggested that it remains supported against April 07, 2025 lows and bounce from the blue box area. In the meantime, keep an eye out for any corrective pullbacks that may offer entry opportunities. By applying Elliott Wave Theory, traders can better anticipate the structure of upcoming moves and enhance risk management in volatile markets. Source: https://www.fxstreet.com/news/microsoft-corp-msft-blue-box-area-offers-a-buying-opportunity-202509171323
Share
BitcoinEthereumNews2025/09/18 03:50
Academic Publishing and Fairness: A Game-Theoretic Model of Peer-Review Bias

Academic Publishing and Fairness: A Game-Theoretic Model of Peer-Review Bias

Exploring how biases in the peer-review system impact researchers' choices, showing how principles of fairness relate to the production of scientific knowledge based on topic importance and hardness.
Share
Hackernoon2025/09/17 23:15
Hadron Labs Launches Bitcoin Summer on Neutron, Offering 5–10% BTC Yield

Hadron Labs Launches Bitcoin Summer on Neutron, Offering 5–10% BTC Yield

Hadron Labs launches 'Bitcoin Summer' on Neutron, BTC vaults for WBTC, eBTC, solvBTC, uniBTC and USDC. Earn 5–10% BTC via maxBTC, with up to 10x looping.
Share
Blockchainreporter2025/09/18 02:00