

Will ETH Price Crash to $500?

Ethereum price has been sliding in recent sessions, and the latest comments from Federal Reserve officials have only added to the uncertainty. While one Fed governor is calling for steep rate cuts, most policymakers remain cautious about inflation risks. This division has left markets guessing—and ETH traders are no exception. The real question: could Ethereum collapse all the way down to $500?
Ethereum Price Prediction: The Fed’s Reluctance to Cut Aggressively
The Federal Reserve’s mixed signals are creating turbulence across risk assets. Three policymakers stressed that inflation remains too high, citing tariffs and other pressures. Their reluctance to slash rates aggressively means borrowing costs could stay higher for longer. For Ethereum, which thrives in a low-rate, high-liquidity environment, this backdrop is bearish.
On the flip side, Stephen Miran’s call for steep cuts aligns with markets’ expectations of at least one more rate cut this year. That has kept ETH price from breaking down completely. Still, the chasm within the Fed creates a volatile setting where crypto assets swing sharply with every policy remark.
Chart Analysis: Breakdown From Range Support
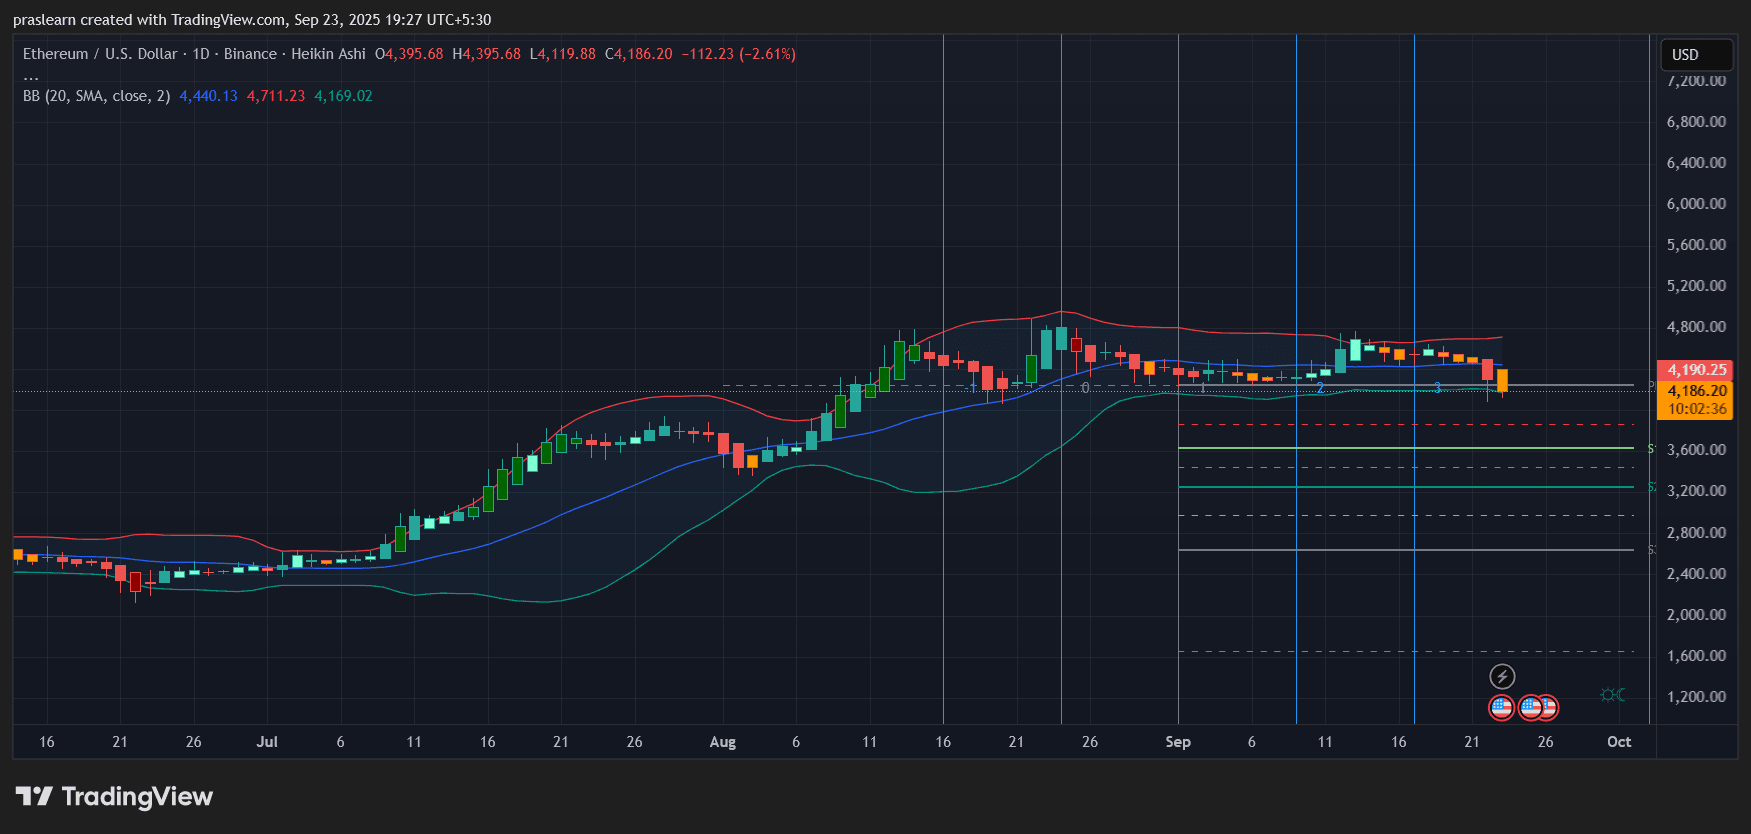 ETH/USD Daily Chart- TradingView
Looking at the daily chart, ETH price has clearly lost momentum. The Heikin Ashi candles show a series of bearish closes, with the price currently hovering near 4,180. ETH has broken below the middle Bollinger Band (around 4,440), which was serving as dynamic support. This signals increased selling pressure.
The lower Bollinger Band sits near 4,169, and Ethereum price is testing this area right now. If it fails to hold, the next visible support levels appear around 3,800, 3,600, and 3,200—each marked by the horizontal dashed lines. Momentum indicators (not shown here but implied by the bearish candles and failed rallies) suggest sellers are in control.
For ETH price to regain strength, it would need to reclaim the 4,400–4,700 zone. Until then, every bounce looks more like relief than reversal.
Ethereum Price Prediction: Could ETH Price Really Drop to $500?
From a pure technical standpoint, a crash to $500 looks extreme. Ethereum price has multiple support layers before such a collapse could even be considered. To reach $500, Ethereum would have to break down through 3,000, 2,000, and 1,200—levels that historically attracted strong buying interest.
That said, black swan scenarios cannot be ruled out. If the Fed mismanages inflation and triggers a deep recession, liquidity could dry up, dragging all risk assets lower. Combine that with a crypto-specific shock—such as a major exchange failure or regulatory crackdown and ETH could face catastrophic downside. But barring such events, a slide to $500 seems unlikely in the near term.
What Traders Should Watch?
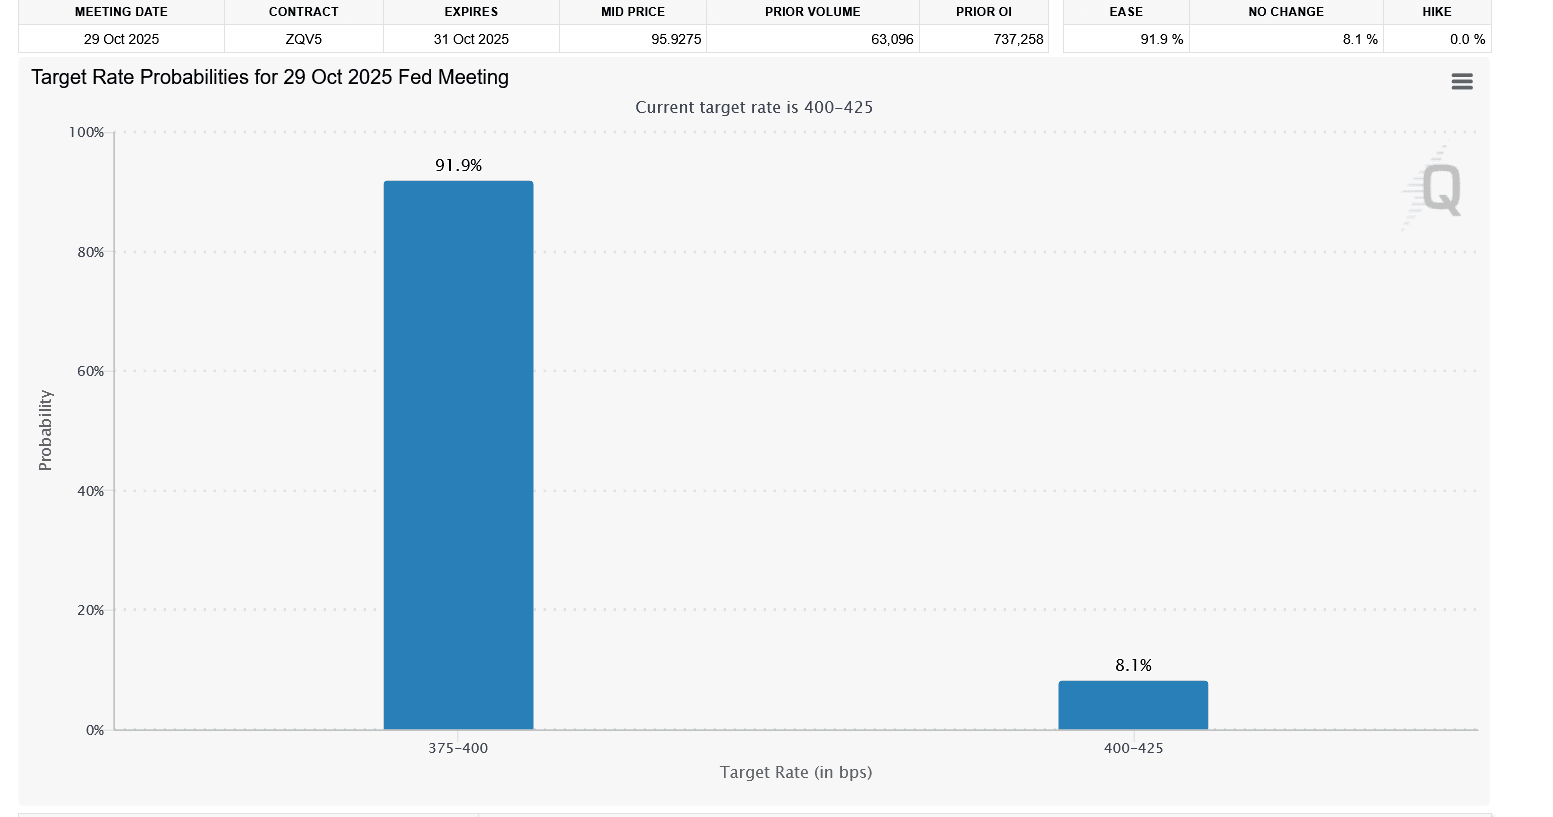
- Fed’s October Meeting: Markets are pricing in a nearly 90% chance of another cut. If the Fed surprises by holding rates, ETH could take another leg down.
- Support Zones: Immediate support lies at 4,169, followed by 3,800 and 3,600. A breakdown through 3,200 would signal deeper trouble.
- Macro Data: Inflation prints and jobs data will drive Fed sentiment. Softer numbers could ease pressure on ETH.
- Crypto-Specific Catalysts: Any SEC action, ETF news, or Ethereum upgrade delays could accelerate volatility.
Ethereum price is under pressure from both macro uncertainty and technical weakness. While talk of a crash to $500 makes for a dramatic headline, the chart does not support such a plunge unless an extraordinary event takes place. More realistically, $ETH could revisit the 3,200–3,600 range if the Fed holds back on rate cuts.
For now, traders should respect the bearish trend but recognize that calls for $500 are more fear-driven than chart-driven.
You May Also Like

Top 9 decentralised exchanges to trade on in March 2026

Whale Dumps Almost 15 Billion SHIB After Two-Year Hold At 83% Loss, But There Is A Catch ⋆ ZyCrypto

