Bitcoin’s Macro Structure Has Not Broken – Monthly Chart Still Points Toward $167,000
Twelve years of price history inside a single ascending channel, three mid-cycle corrections that all recovered, and Fibonacci expansion targets that remain unmet. EGRAG Crypto’s monthly analysis argues the current drawdown fits the pattern rather than breaking it.
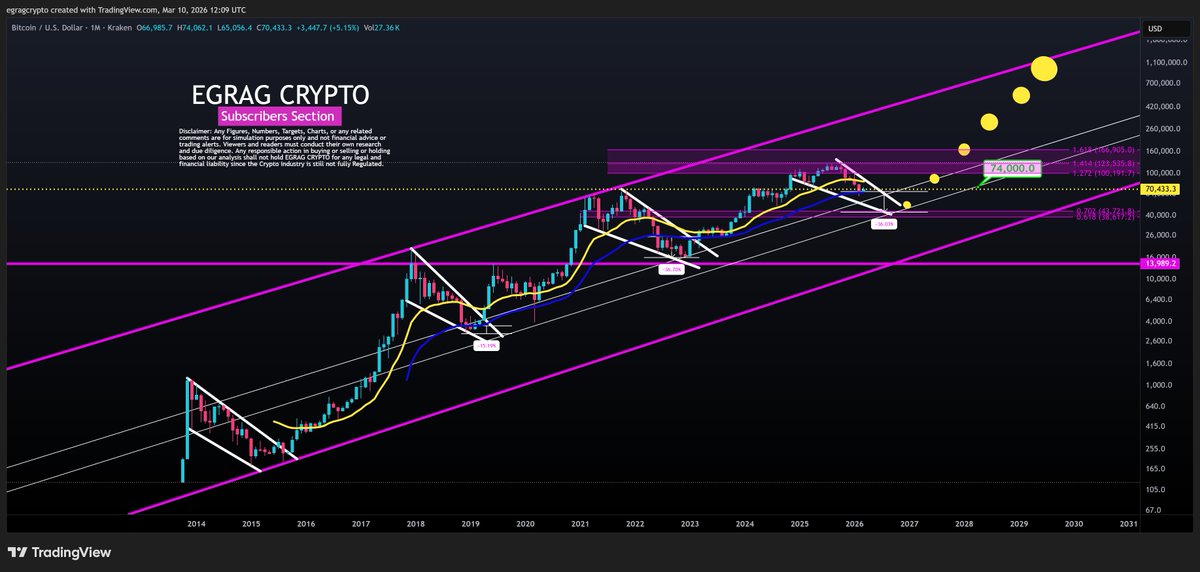
The Channel That Has Held Since 2014
The monthly BTC/USD chart on a logarithmic scale shows Bitcoin trading inside the same ascending parallel channel since 2014. Every major cycle bottom has touched or approached the lower channel boundary before recovering. Every cycle top has reached toward the upper boundary before pulling back. The channel has not been broken in twelve years of price action across four distinct market cycles.
 Source: https://x.com/egragcrypto/status/2031341857574187291
Bitcoin currently sits in the mid-to-upper portion of that channel at $70,433. That positioning is consistent with a mid-cycle correction rather than a macro top. Macro tops on this chart have historically occurred when price reaches the upper channel boundary, a level that currently sits well above $200,000 and rising. The current price is nowhere near it.
Mid-Cycle Corrections Are the Pattern, Not the Exception
EGRAG identifies three historical mid-cycle resets measured from the 50 EMA. The first produced a 15% drawdown. The second 36%. The third, during the 2021 cycle, also 36%. Each reset occurred during what was ultimately a continuing bull market. Each one felt like a potential macro top in real time. None of them were.
The current correction from $108,000 to the $60,000 low represents approximately a 44% drawdown, slightly deeper than the two 36% historical analogs but within the range that mid-cycle corrections have historically produced on logarithmic scale. The depth alone does not disqualify the bull market continuation scenario.
The Fibonacci Targets That Remain Unmet
Three expansion levels define EGRAG’s upside targets from the current structure. The 1.272 extension sits at $100,000, the level Bitcoin briefly touched before pulling back. The 1.414 extension sits at $123,000, near the all-time high territory. The 1.618 extension sits at $167,000, described explicitly as still missing. In Fibonacci expansion analysis, the 1.618 level is considered the natural completion target for an impulsive move. Bitcoin has reached the 1.272 and approached the 1.414 without yet achieving the 1.618. The structure remains incomplete by that measure.
The Two Scenarios and Their Assigned Probabilities
EGRAG assigns approximately 60% to 70% probability to the continuation path: hold the channel, break above $74,000, expand toward $100,000, $123,000, and eventually $167,000 in sequence. The $74,000 level is the immediate trigger. Bitcoin is currently trading at $70,433, approximately 5% below that threshold. A sustained close above it would be the first confirmation that the mid-cycle correction is resolved.
The remaining 30% to 40% probability goes to a deep reset scenario: a retest of the $38,000 to $43,000 zone before the next expansion begins. That range represents confluence of three independent technical factors simultaneously. The 0.618 and 0.702 Fibonacci retracement levels from the entire current cycle converge there.
The lower channel boundary passes through that zone on the current timeframe. Prior consolidation from 2023 established that range as structural support. If Bitcoin loses the current channel mid-point decisively, that is where the structure says buyers should appear.
The Longer-Term Framing
The most significant element of EGRAG’s analysis is the cycle transition thesis. Bitcoin may be moving from a four-year halving-driven cycle into a longer liquidity-driven expansion phase as institutional participation deepens and ETF inflows create persistent structural demand independent of halving mechanics. If that transition is occurring, the historical four-year cycle templates become less reliable as timing guides while the macro channel structure remains valid as a directional framework.
The channel has held for twelve years. The Fibonacci targets are unmet. The mid-cycle correction fits the historical pattern. Structure over noise, as EGRAG puts it, currently points up.
The post Bitcoin’s Macro Structure Has Not Broken – Monthly Chart Still Points Toward $167,000 appeared first on ETHNews.


Potrebbe anche piacerti

The Agentic AI Era Demands New Entry-Level Roles. Are SA Companies Creating Them?

South Africa agriculture trade faces Middle East risks