Silver Price Could Explode as Banks Rush to Cover Massive Short Positions
Silver has been moving sideways over the past few days after an extremely volatile period. The metal is currently trading around $84 per ounce, far below the all-time high near $121 that was briefly reached earlier this year. That rally was followed by a violent correction, with silver briefly plunging toward the mid-$60s before stabilizing.
Now a new narrative is spreading through the precious metals community. Some analysts believe that what we are seeing may not be the end of the move but the early stage of a much larger one.
A recent post from WallStreetBulls on X claims that large banks are aggressively covering their short positions in silver, which could remove one of the biggest forces that has historically capped the price.
Banks May Be Covering Shorts
Based on the thread shared by WallStreetBulls, the so-called “Big 8” commercial traders have dramatically reduced their short exposure in the silver market.
For years, silver was considered one of the most heavily shorted commodities relative to its annual production. Large banks frequently held massive short positions, which many analysts believed helped suppress price rallies by increasing paper supply in the futures market.
But the data highlighted in the post indicates that something may be changing.
The 5th through 8th largest traders have reportedly reduced their short positions to the smallest levels ever recorded. That leaves the “Big 4” traders, mostly large U.S. banks, as the primary players still holding significant short exposure.
If those remaining traders start closing positions as well, it could create a short-covering wave, where traders buy silver to exit their positions. That kind of buying pressure can push prices higher quickly, especially in markets where physical supply is tight.
The thread even floated the possibility that such a dynamic could eventually open the path toward $200 silver, although that scenario would likely require a broader macro change and sustained demand.
Read also: ChatGPT Predicts The Price Of Bitcoin And Silver If U.S. And Iran Agree To End The War
Silver Price Chart Shows Key Support and Resistance
Looking at the recent silver chart helps explain why the market is currently stuck in a consolidation phase.
The price structure shows that silver formed a major peak near $120 earlier this year before crashing heavily in early February. That drop brought the silver price down toward the $65–$70 zone, which has since acted as a strong support area.
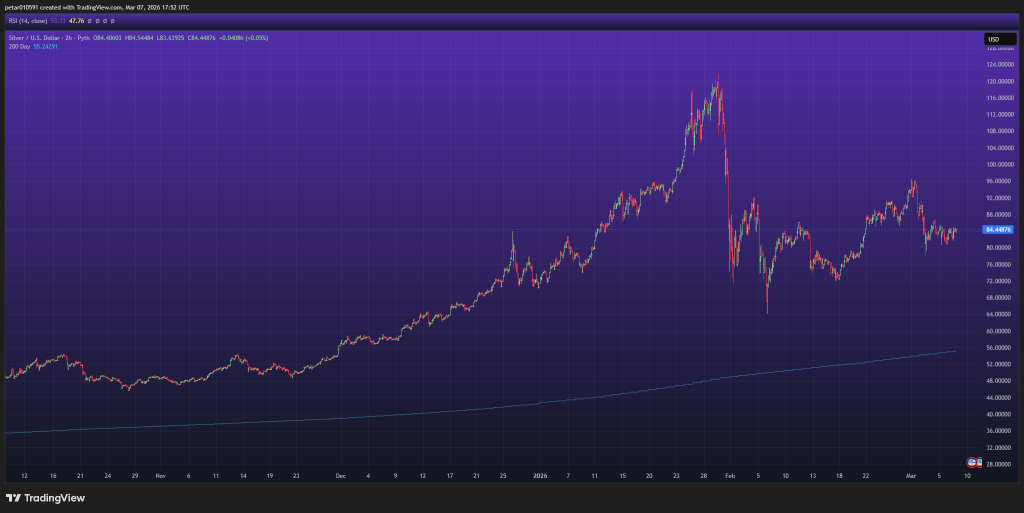 Source: TradingView
Since then, the market has been recovering gradually, but the chart shows clear resistance levels overhead.
The most immediate resistance is at around $90–$95, where the price has already been rejected several times. A clean breakout above this area would likely reopen the path toward the $100 psychological level.
On the downside, the $80 zone appears to be the first key support in the short term. If that level breaks, traders will likely watch the $72–$75 range, which previously acted as a rebound zone after the February crash.
For now, silver appears to be consolidating between roughly $80 and $90, building a range after the earlier extreme volatility.
If the bullish narrative around short covering gains traction and the price breaks above resistance, momentum could return quickly. But if the market loses support again, silver may spend more time moving sideways before attempting another major rally.
Subscribe to our YouTube channel for daily crypto updates, market insights, and expert analysis.
The post Silver Price Could Explode as Banks Rush to Cover Massive Short Positions appeared first on CaptainAltcoin.


Potrebbe anche piacerti

Financial Planning Partners Joins Encore Financial, Expanding Affiliated Advisors Network

AI Agents Are Making Decisions for Your Business. Who’s Watching Them?