

Bitcoin Adoption Keeps Growing While Exchange Supply Hits Its Lowest Point in Eight Years
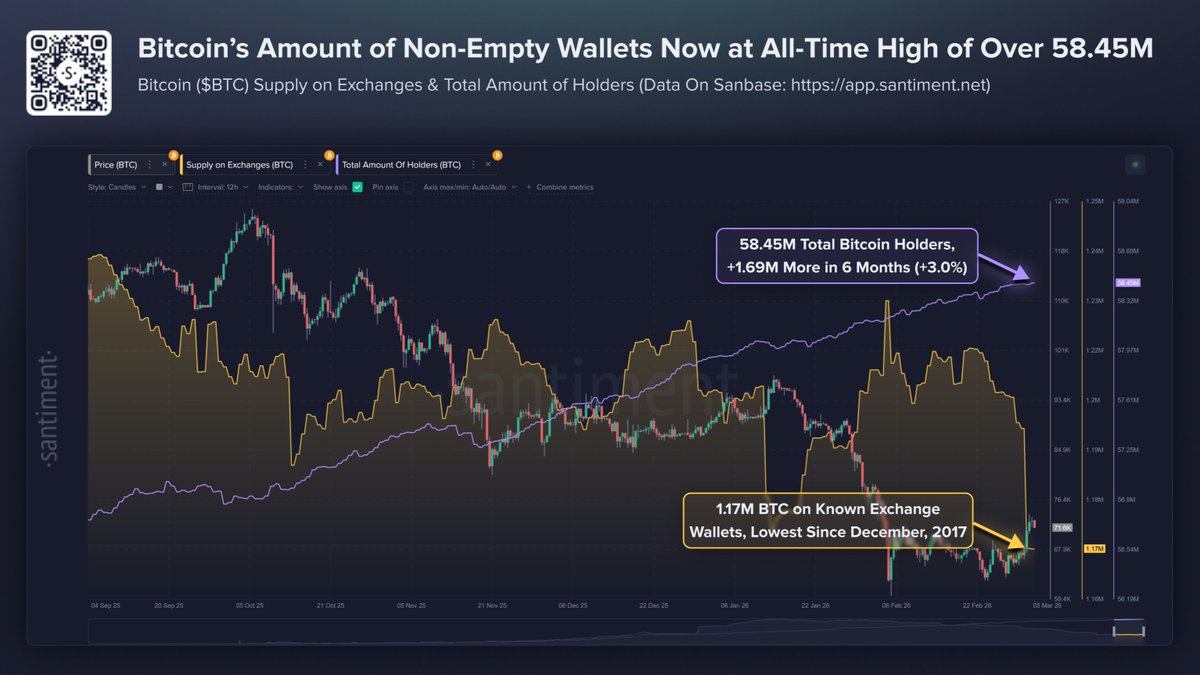
Bitcoin’s network just hit 58.45 million non-empty wallets, an all-time high, while the amount of BTC sitting on known exchange wallets dropped to 1.17 million, the lowest level since December 2017. Both numbers moved in the same direction at the same time. That is not a coincidence.
What Each Number Means Separately
The wallet count reaching 58.45 million represents a 3% increase over six months, adding 1.69 million new non-empty wallets since September 2025. A non-empty wallet is the most basic measure of network adoption. Someone created a wallet and put Bitcoin in it. They have not emptied it. At 58.45 million that metric has never been higher, meaning more individual holders exist on the Bitcoin network today than at any point in its history, including the peaks of the 2021 and 2025 bull runs.
 Source: https://x.com/santimentfeed/status/2029697093271503161
Exchange supply dropping to 1.17 million BTC is a different kind of signal. Bitcoin sitting on exchange wallets is Bitcoin available to sell. When that number falls, less supply is positioned for immediate sale. The last time exchange supply was this low was December 2017, the month Bitcoin hit its then-all-time high of approximately $20,000 before a prolonged bear market. The comparison is not straightforwardly bullish. But the supply dynamic it describes is.
Why Both Moving Together Matters
More holders and less exchange supply is a structural combination. New wallets being created means demand is growing. Bitcoin leaving exchanges into private cold storage means existing holders are moving coins away from venues where selling is frictionless. Both behaviors, new accumulation and cold storage migration, reduce the available float of Bitcoin that can be sold at any given moment.
The Santiment chart shows the exchange supply line declining consistently through the recent period even as price experienced significant volatility. Holders did not panic-sell into exchanges during February’s 14.94% monthly decline. They held and in many cases continued withdrawing. That behavior during a down month is a different signal than the same behavior during a rally.
The 28,700 BTC net exchange outflow recorded on March 4 covered earlier this week fits directly into this longer trend. Single-day outflows are noise. Eight months of declining exchange supply is a pattern.
The Honest Caveat
Low exchange supply and high wallet counts have been present during both bull and bear markets historically. The metric describes positioning and adoption, not price direction. What it rules out is the narrative that Bitcoin adoption is stalling or that holders are preparing to distribute. Neither is visible in this data. What is visible is a network with more participants than ever and less immediately sellable supply than at any point in nearly eight years.
The post Bitcoin Adoption Keeps Growing While Exchange Supply Hits Its Lowest Point in Eight Years appeared first on ETHNews.


Potrebbe anche piacerti
XRP Price Prediction 2026: Where Is XRP Heading ? While Pepeto Targets 300x as US Jobs Data Reshapes the Next Crypto Rally

Why Passive BTC Models Like Bitcoin Everlight Are Gaining Momentum in 2026
![MANTRA [Old] Token Surges 431% Despite Ultra-Low Volume: What’s Behind OM’s Price Spike](https://mexc-rainbown-activityimages.s3.ap-northeast-1.amazonaws.com/banner/F20250611171322179ZvSQ9JOYMLWD78.png)


