Solana price has formed a swing failure patternSolana price has formed a swing failure pattern

Solana price forms sfp pattern at fibonacci support, local bottom in?

2026/02/25 03:31
4 min di lettura
Per feedback o dubbi su questo contenuto, contattateci all'indirizzo crypto.news@mexc.com.

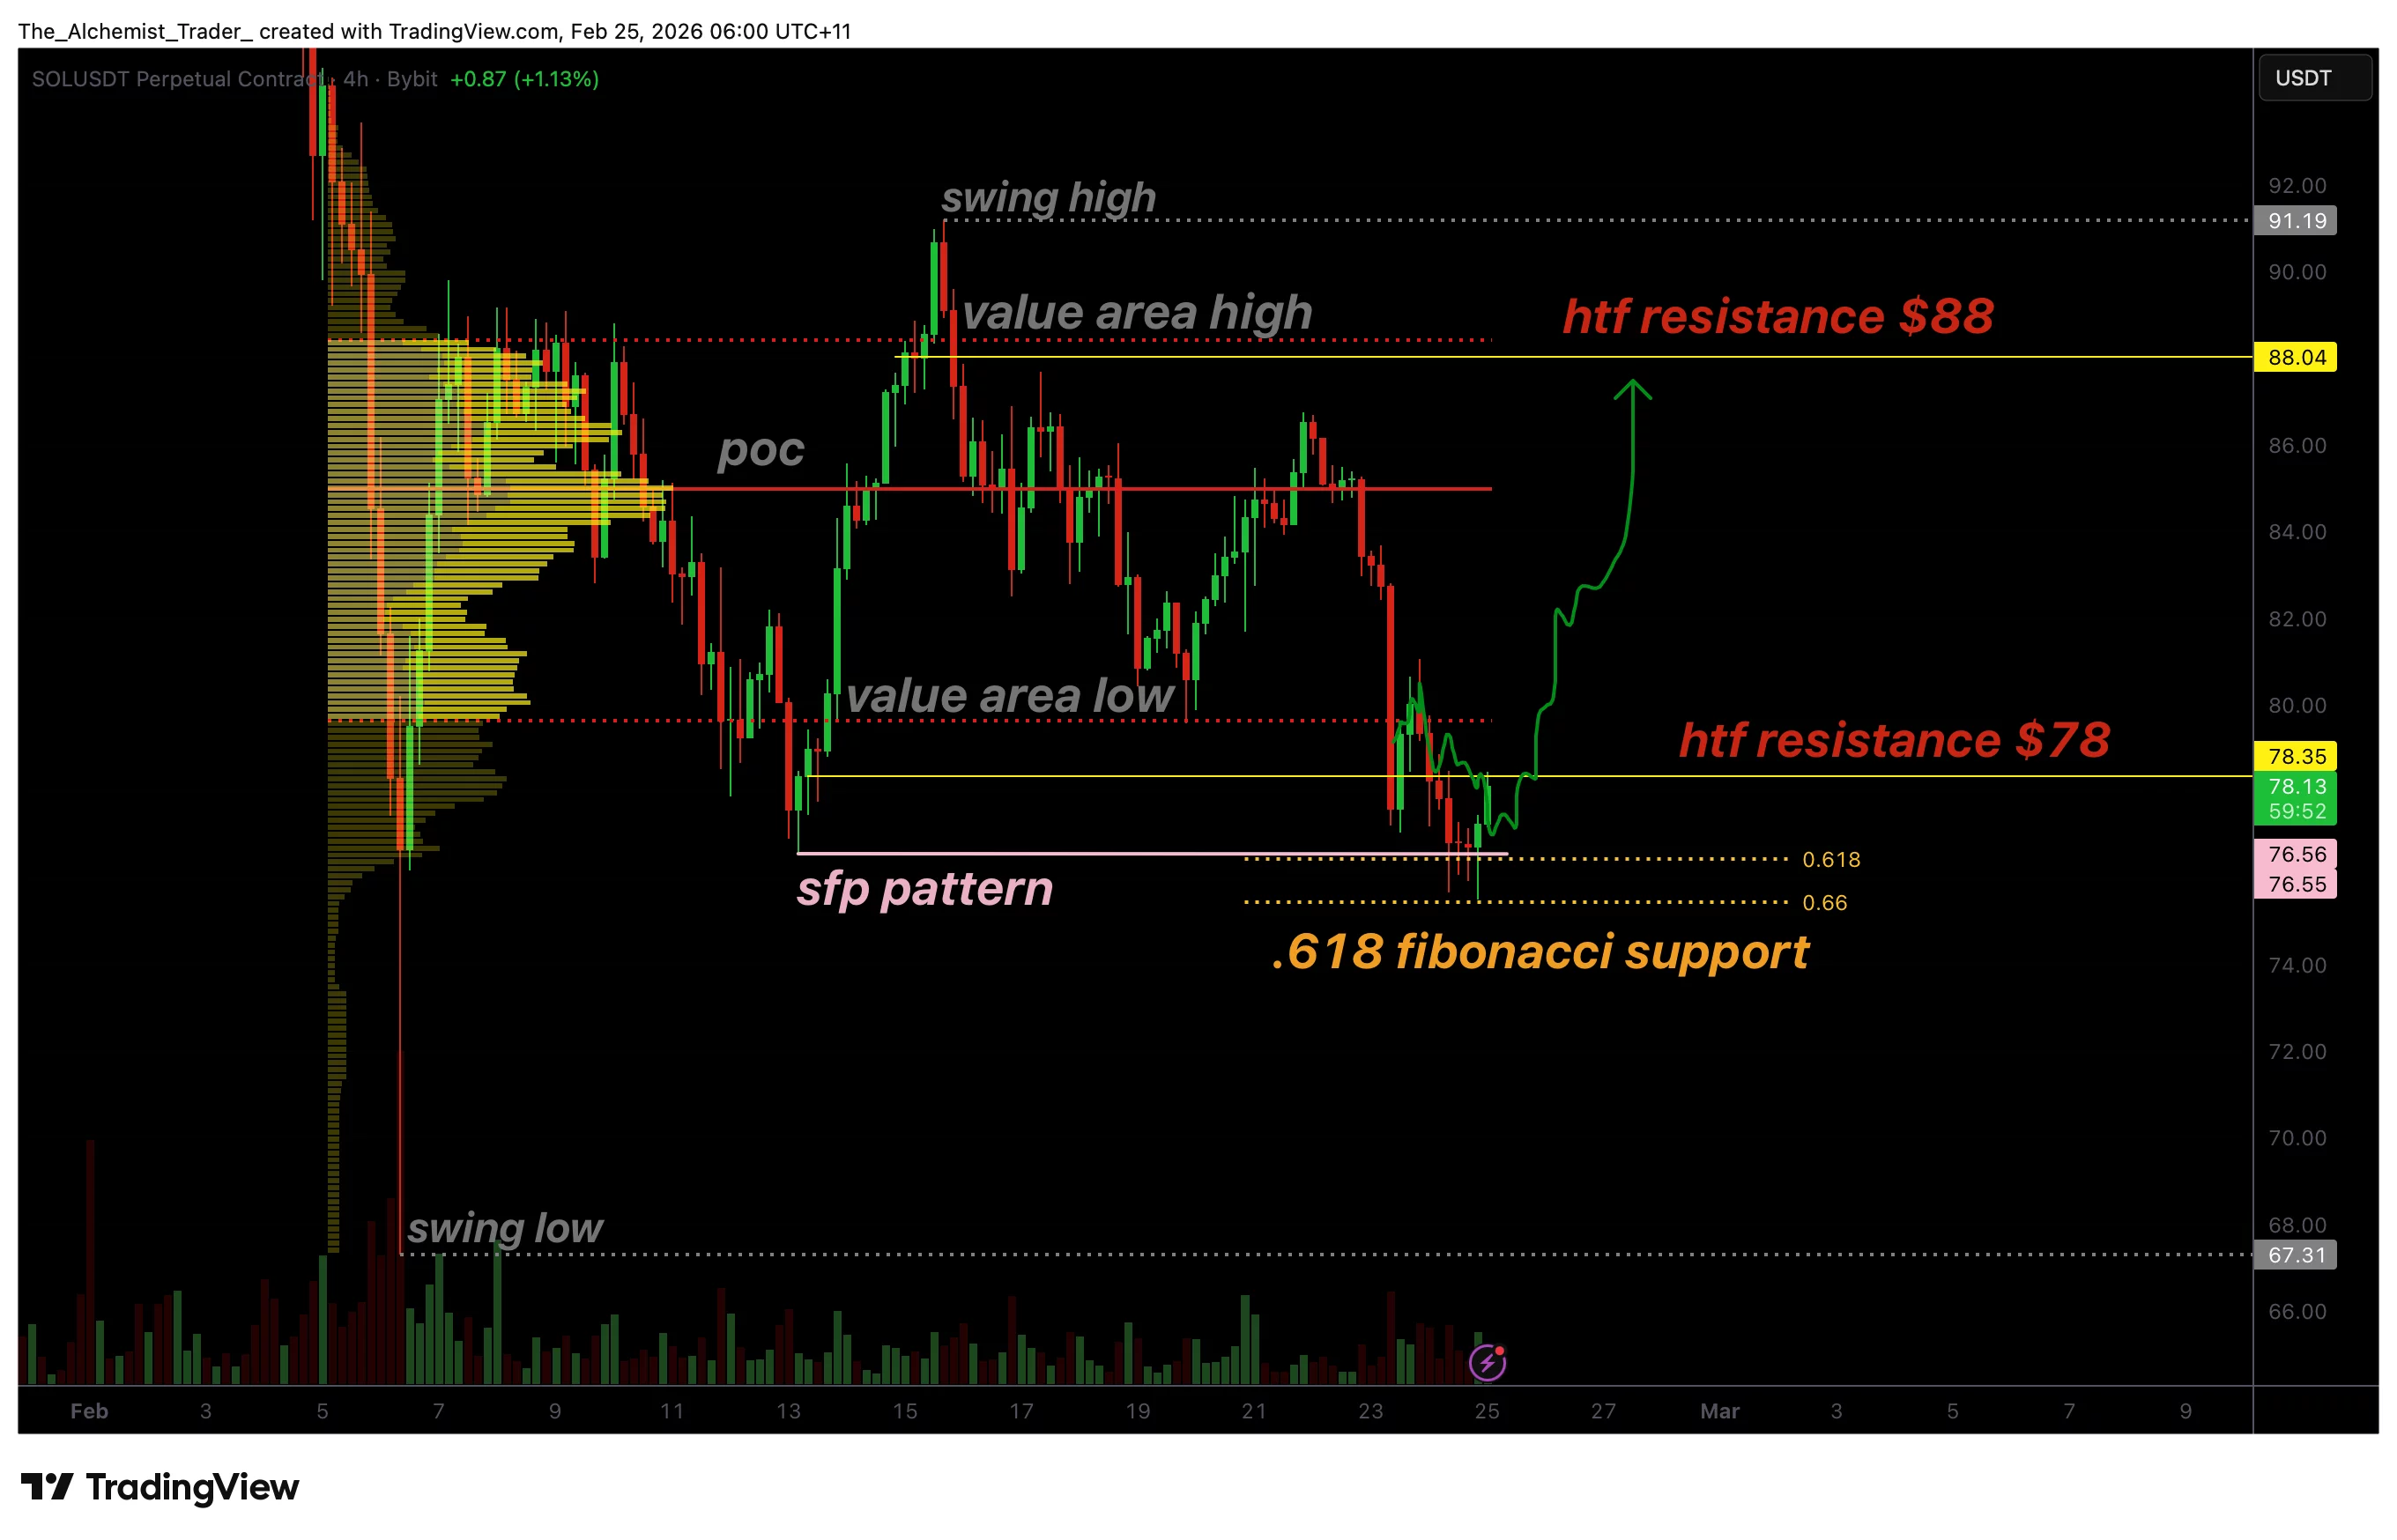
Solana price has formed a swing failure pattern at the 0.618 Fibonacci support, signaling potential demand and raising the probability of a short-term reversal.

Summary
  • Swing failure pattern formed at key 0.618 Fibonacci support
  • $78 resistance reclaim needed to confirm reversal structure
  • Upside target toward $88 if bullish momentum strengthens

Solana (SOL) price action is displaying a technically significant development as a swing failure pattern (SFP) forms at a key Fibonacci support level. After an extended corrective move, Solana briefly broke below its previous swing low, only to quickly reclaim it, leaving multiple downside wicks on the chart. This type of price behavior often signals liquidity absorption and the presence of underlying demand.

The SFP has emerged at the 0.618 Fibonacci retracement level, a historically important support area that traders closely monitor during pullbacks. When liquidity is swept below prior lows and price immediately recovers, it frequently indicates that sellers are losing momentum and buyers are stepping in at discounted levels.

While confirmation is still required, the current setup raises the question of whether Solana is forming a local bottom within its broader trading structure.

Solana price key technical points

  • Swing failure pattern confirmed: Previous low swept with strong rejection
  • 0.618 Fibonacci support respected: Key retracement level attracting demand
  • $78 resistance pivotal: Reclaim could trigger acceleration toward $88
Solana price forms sfp pattern at fibonacci support, local bottom in? - 1

The defining feature of this setup is the swing failure pattern itself. An SFP occurs when price breaks below a prior swing low, triggers stop-loss liquidity, and then quickly reverses back above that level. This behavior traps aggressive sellers and often fuels short-term upward momentum.

In Solana’s case, multiple wicks below the previous low demonstrate that price attempted to trade lower but failed to find acceptance. Instead, buyers absorbed the selling pressure and pushed price back into prior structure.

These types of technical reactions are especially meaningful when they occur at major Fibonacci levels, even as broader ecosystem developments, including Step Finance shutting down its Solana-based platforms after a January hack that reportedly drained up to $40 million, continue to influence market sentiment.

The 0.618 retracement is widely regarded as one of the most important levels in technical analysis. Markets frequently react strongly here, as it represents a deep corrective zone within a broader trend. Solana’s ability to defend this level strengthens the argument that a bounce may already be underway.

Market structure shifts toward reversal potential

From a market structure perspective, early signs of reversal are beginning to form. The SFP suggests that downside momentum may be fading, but confirmation requires a shift in local resistance levels.

The key level to monitor now is $78. This region represents local resistance and an important decision point. For Solana to transition from corrective bounce to confirmed reversal, price must reclaim and hold above $78. Acceptance above this level would signal structural improvement and invalidate the immediate bearish bias.

Reclaiming $78 would also position Solana back above the value area low, an important benchmark in volume-based analysis. When price regains this level, it often reflects improving sentiment and increasing participation from buyers, particularly as ecosystem developments continue to evolve, including Zora expanding onto the Solana blockchain with its new “attention markets” product beyond its earlier NFT and Ethereum focus.

$88 emerges as next upside objective

If Solana successfully reclaims $78, the probability increases for an accelerated move toward the next high-timeframe resistance at $88. This level aligns with prior distribution zones and serves as a natural liquidity target following a confirmed SFP.

The move toward $88 would represent not only a relief rally but also a meaningful structural recovery within the broader market context. A break above this level would further reinforce the bullish thesis and potentially shift the medium-term outlook.

However, failure to reclaim $78 would weaken the setup. In that scenario, the SFP may represent only a temporary reaction rather than the start of sustained upside continuation.

What to expect in the coming price action

From a technical, price action, and market structure perspective, Solana is at a critical inflection point. The swing failure pattern at the 0.618 Fibonacci support suggests a potential local bottom may be forming. Confirmation now hinges on a decisive reclaim of the $78 resistance level. If achieved, Solana could accelerate toward $88 and reclaim higher value zones in the short term.

Until then, the market remains in a reaction phase, with traders closely watching resistance for validation of a broader reversal.

Opportunità di mercato
Logo SafePal
Valore SafePal (SFP)
$0.3007
$0.3007$0.3007
+3.08%
USD
Grafico dei prezzi in tempo reale di SafePal (SFP)
Disclaimer: gli articoli ripubblicati su questo sito provengono da piattaforme pubbliche e sono forniti esclusivamente a scopo informativo. Non riflettono necessariamente le opinioni di MEXC. Tutti i diritti rimangono agli autori originali. Se ritieni che un contenuto violi i diritti di terze parti, contatta crypto.news@mexc.com per la rimozione. MEXC non fornisce alcuna garanzia in merito all'accuratezza, completezza o tempestività del contenuto e non è responsabile per eventuali azioni intraprese sulla base delle informazioni fornite. Il contenuto non costituisce consulenza finanziaria, legale o professionale di altro tipo, né deve essere considerato una raccomandazione o un'approvazione da parte di MEXC.

Potrebbe anche piacerti

VGTEL in Strategic Talks to Acquire Consciousness-Focused Health-Tech Platform

VGTEL in Strategic Talks to Acquire Consciousness-Focused Health-Tech Platform

VGTEL enters strategic discussions to acquire breakthrough health-tech app from 4biddenknowledge. Emerging wellness platform combines data-driven insights with
Condividi
Citybuzz2026/03/24 21:15
Top 10 free crypto cloud mining platforms in 2026

Top 10 free crypto cloud mining platforms in 2026

Cloud mining is growing in 2026 as users seek simpler, hardware-free access to crypto mining rewards. Cloud mining has continued to expand in 2026 as more users
Condividi
Crypto.news2026/03/24 22:30
Crucial US Stock Market Update: What Wednesday’s Mixed Close Reveals

Crucial US Stock Market Update: What Wednesday’s Mixed Close Reveals

BitcoinWorld Crucial US Stock Market Update: What Wednesday’s Mixed Close Reveals The financial world often keeps us on our toes, and Wednesday was no exception. Investors watched closely as the US stock market concluded the day with a mixed performance across its major indexes. This snapshot offers a crucial glimpse into current investor sentiment and economic undercurrents, prompting many to ask: what exactly happened? Understanding the Latest US Stock Market Movements On Wednesday, the closing bell brought a varied picture for the US stock market. While some indexes celebrated gains, others registered slight declines, creating a truly mixed bag for investors. The Dow Jones Industrial Average showed resilience, climbing by a notable 0.57%. This positive movement suggests strength in some of the larger, more established companies. Conversely, the S&P 500, a broader benchmark often seen as a barometer for the overall market, experienced a modest dip of 0.1%. The technology-heavy Nasdaq Composite also saw a slight retreat, sliding by 0.33%. This particular index often reflects investor sentiment towards growth stocks and the tech sector. These divergent outcomes highlight the complex dynamics currently at play within the American economy. It’s not simply a matter of “up” or “down” for the entire US stock market; rather, it’s a nuanced landscape where different sectors and company types are responding to unique pressures and opportunities. Why Did the US Stock Market See Mixed Results? When the US stock market delivers a mixed performance, it often points to a tug-of-war between various economic factors. Several elements could have contributed to Wednesday’s varied closings. For instance, positive corporate earnings reports from certain industries might have bolstered the Dow. At the same time, concerns over inflation, interest rate policies by the Federal Reserve, or even global economic uncertainties could have pressured growth stocks, affecting the S&P 500 and Nasdaq. Key considerations often include: Economic Data: Recent reports on employment, manufacturing, or consumer spending can sway market sentiment. Corporate Announcements: Strong or weak earnings forecasts from influential companies can significantly impact their respective sectors. Interest Rate Expectations: The prospect of higher or lower interest rates directly influences borrowing costs for businesses and consumer spending, affecting future profitability. Geopolitical Events: Global tensions or trade policies can introduce uncertainty, causing investors to become more cautious. Understanding these underlying drivers is crucial for anyone trying to make sense of daily market fluctuations in the US stock market. Navigating Volatility in the US Stock Market A mixed close, while not a dramatic downturn, serves as a reminder that market volatility is a constant companion for investors. For those involved in the US stock market, particularly individuals managing their portfolios, these days underscore the importance of a well-thought-out strategy. It’s important not to react impulsively to daily movements. Instead, consider these actionable insights: Diversification: Spreading investments across different sectors and asset classes can help mitigate risk when one area underperforms. Long-Term Perspective: Focusing on long-term financial goals rather than short-term gains can help weather daily market swings. Stay Informed: Keeping abreast of economic news and company fundamentals provides context for market behavior. Consult Experts: Financial advisors can offer personalized guidance based on individual risk tolerance and objectives. Even small movements in major indexes can signal shifts that require attention, guiding future investment decisions within the dynamic US stock market. What’s Next for the US Stock Market? Looking ahead, investors will be keenly watching for further economic indicators and corporate announcements to gauge the direction of the US stock market. Upcoming inflation data, statements from the Federal Reserve, and quarterly earnings reports will likely provide more clarity. The interplay of these factors will continue to shape investor confidence and, consequently, the performance of the Dow, S&P 500, and Nasdaq. Remaining informed and adaptive will be key to understanding the market’s trajectory. Conclusion: Wednesday’s mixed close in the US stock market highlights the intricate balance of forces influencing financial markets. While the Dow showed strength, the S&P 500 and Nasdaq experienced slight declines, reflecting a nuanced economic landscape. This reminds us that understanding the ‘why’ behind these movements is as important as the movements themselves. As always, a thoughtful, informed approach remains the best strategy for navigating the complexities of the market. Frequently Asked Questions (FAQs) Q1: What does a “mixed close” mean for the US stock market? A1: A mixed close indicates that while some major stock indexes advanced, others declined. It suggests that different sectors or types of companies within the US stock market are experiencing varying influences, rather than a uniform market movement. Q2: Which major indexes were affected on Wednesday? A2: On Wednesday, the Dow Jones Industrial Average gained 0.57%, while the S&P 500 edged down 0.1%, and the Nasdaq Composite slid 0.33%, illustrating the mixed performance across the US stock market. Q3: What factors contribute to a mixed stock market performance? A3: Mixed performances in the US stock market can be influenced by various factors, including specific corporate earnings, economic data releases, shifts in interest rate expectations, and broader geopolitical events that affect different market segments uniquely. Q4: How should investors react to mixed market signals? A4: Investors are generally advised to maintain a long-term perspective, diversify their portfolios, stay informed about economic news, and avoid impulsive decisions. Consulting a financial advisor can also provide personalized guidance for navigating the US stock market. Q5: What indicators should investors watch for future US stock market trends? A5: Key indicators to watch include upcoming inflation reports, statements from the Federal Reserve regarding monetary policy, and quarterly corporate earnings reports. These will offer insights into the future direction of the US stock market. Did you find this analysis of the US stock market helpful? Share this article with your network on social media to help others understand the nuances of current financial trends! To learn more about the latest stock market trends, explore our article on key developments shaping the US stock market‘s future performance. This post Crucial US Stock Market Update: What Wednesday’s Mixed Close Reveals first appeared on BitcoinWorld.
Condividi
Coinstats2025/09/18 05:30