The post Here’s Why Bitcoin Price is Falling Continues? appeared first on Coinpedia Fintech News Over the past month, the Bitcoin price has dropped 26%, fallingThe post Here’s Why Bitcoin Price is Falling Continues? appeared first on Coinpedia Fintech News Over the past month, the Bitcoin price has dropped 26%, falling

Here’s Why Bitcoin Price is Falling Continues?

2026/02/19 16:32
2 min di lettura
Per feedback o dubbi su questo contenuto, contattateci all'indirizzo crypto.news@mexc.com.
Bitcoin Price

The post Here’s Why Bitcoin Price is Falling Continues? appeared first on Coinpedia Fintech News

Over the past month, the Bitcoin price has dropped 26%, falling from its January high of $97,682 to around $67,190. It is struggling to recover, which has made many investors worried. Even with strong institutional buying and strong global liquidity, Bitcoin value is still lagging behind assets like gold and silver.

Lost Bitcoin Supply and Quantum Computing Fear

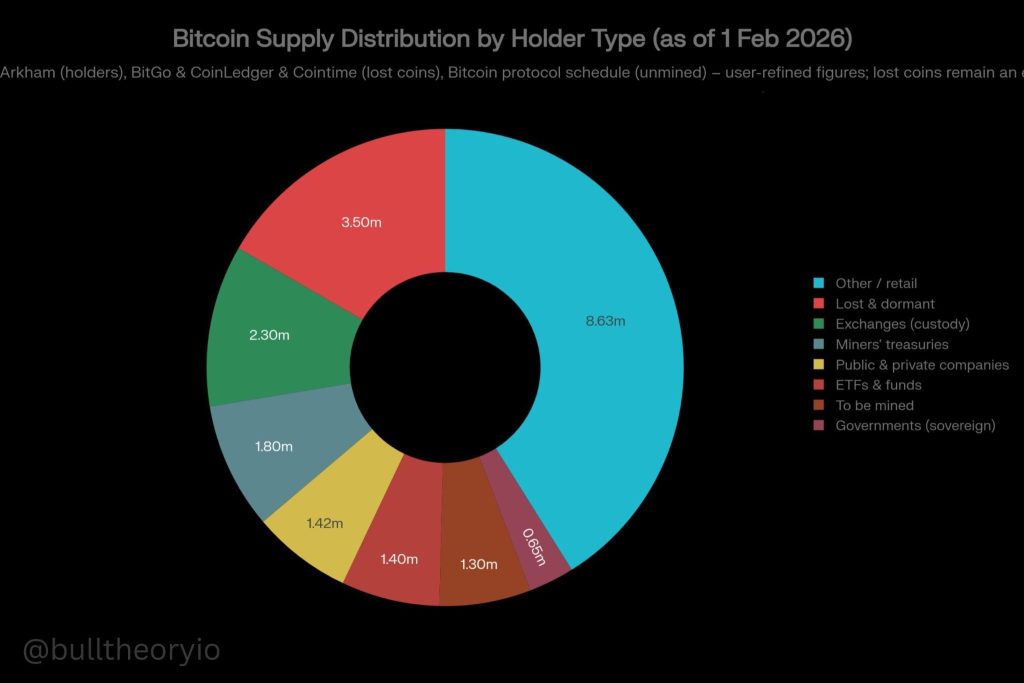
One major concern affecting Bitcoin value is the large amount of lost or inactive coins. Crypto experts estimate that around 3.5 to 4 million BTC, nearly 18% of the total supply, have not moved since Bitcoin’s early days and are believed to be permanently lost.

Perhaps, with fast progress in quantum computing, analysts believe these old wallets could become easier to access in the future. Even though this risk is not confirmed, markets react to such possibilities. 

Bitcoin price Supply

If investors expect some of these coins to return, it increases future supply fears, which can put pressure on Bitcoin’s price.

Institutional Buying Matches Lost Bitcoin Supply

Interestingly, institutional investors have been buying Bitcoin aggressively over the past few years. Since the launch of the spot Bitcoin ETF, institutions & corporations have accumulated around 2.5 to 3 million BTC. This amount is almost equal to the number of coins believed to be lost.

This means that while new demand exists, the fear of future supply returning is balancing out bullish momentum. As a result, Bitcoin is not seeing the strong price growth many expected.

Massive Bitcoin Redistribution Adds Selling Pressure

On-chain data shows that around 13 to 14 million BTC have already moved in this market cycle, marking the largest redistribution in Bitcoin’s history.

Despite this massive movement, Bitcoin did not see a full crash. This shows the market has already absorbed a large amount of supply.

Because of this, fears about another 3 to 4 million BTC returning in the future may have a smaller impact than many expect.

Bitcoin Price Liquidations Trigger Market Panic

Bitcoin price also reacted after the Fed decided to keep interest rates unchanged. This added pressure on the market. Coinglass data shows that around $223 million was liquidated in the last. 

Meanwhile, Bitcoin alone saw a liquidation of $78 million after falling below its important 200-week EMA level near $68,000. 

As of now, Bitcoin is trading near $66,900, showing continued weakness in market momentum.

Opportunità di mercato
Logo The Official 67 Coin
Valore The Official 67 Coin (67)
$0,001428
$0,001428$0,001428
+%3,10
USD
Grafico dei prezzi in tempo reale di The Official 67 Coin (67)
Disclaimer: gli articoli ripubblicati su questo sito provengono da piattaforme pubbliche e sono forniti esclusivamente a scopo informativo. Non riflettono necessariamente le opinioni di MEXC. Tutti i diritti rimangono agli autori originali. Se ritieni che un contenuto violi i diritti di terze parti, contatta crypto.news@mexc.com per la rimozione. MEXC non fornisce alcuna garanzia in merito all'accuratezza, completezza o tempestività del contenuto e non è responsabile per eventuali azioni intraprese sulla base delle informazioni fornite. Il contenuto non costituisce consulenza finanziaria, legale o professionale di altro tipo, né deve essere considerato una raccomandazione o un'approvazione da parte di MEXC.

Potrebbe anche piacerti

What Happens to ETH If $1,800 Breaks? Analyst Has the Answer

What Happens to ETH If $1,800 Breaks? Analyst Has the Answer

The post What Happens to ETH If $1,800 Breaks? Analyst Has the Answer appeared on BitcoinEthereumNews.com. Analyst alicharts maps ETH accumulation zones from $1
Condividi
BitcoinEthereumNews2026/04/07 19:09
Riot Sells 500 BTC for $34.87 Million

Riot Sells 500 BTC for $34.87 Million

Riot Platforms has sold another 500 BTC worth approximately $34.87 million, bringing its total sales to 1,500 BTC—over $102 million—in just five days. Moves of
Condividi
Coinfomania2026/04/07 19:02
Edges higher ahead of BoC-Fed policy outcome

Edges higher ahead of BoC-Fed policy outcome

The post Edges higher ahead of BoC-Fed policy outcome appeared on BitcoinEthereumNews.com. USD/CAD gains marginally to near 1.3760 ahead of monetary policy announcements by the Fed and the BoC. Both the Fed and the BoC are expected to lower interest rates. USD/CAD forms a Head and Shoulder chart pattern. The USD/CAD pair ticks up to near 1.3760 during the late European session on Wednesday. The Loonie pair gains marginally ahead of monetary policy outcomes by the Bank of Canada (BoC) and the Federal Reserve (Fed) during New York trading hours. Both the BoC and the Fed are expected to cut interest rates amid mounting labor market conditions in their respective economies. Inflationary pressures in the Canadian economy have cooled down, emerging as another reason behind the BoC’s dovish expectations. However, the Fed is expected to start the monetary-easing campaign despite the United States (US) inflation remaining higher. Investors will closely monitor press conferences from both Fed Chair Jerome Powell and BoC Governor Tiff Macklem to get cues about whether there will be more interest rate cuts in the remainder of the year. According to analysts from Barclays, the Fed’s latest median projections for interest rates are likely to call for three interest rate cuts by 2025. Ahead of the Fed’s monetary policy, the US Dollar Index (DXY), which tracks the Greenback’s value against six major currencies, holds onto Tuesday’s losses near 96.60. USD/CAD forms a Head and Shoulder chart pattern, which indicates a bearish reversal. The neckline of the above-mentioned chart pattern is plotted near 1.3715. The near-term trend of the pair remains bearish as it stays below the 20-day Exponential Moving Average (EMA), which trades around 1.3800. The 14-day Relative Strength Index (RSI) slides to near 40.00. A fresh bearish momentum would emerge if the RSI falls below that level. Going forward, the asset could slide towards the round level of…
Condividi
BitcoinEthereumNews2025/09/18 01:23

$30,000 in PRL + 15,000 USDT

$30,000 in PRL + 15,000 USDT$30,000 in PRL + 15,000 USDT

Deposit & trade PRL to boost your rewards!