Bitcoin Price Prediction: Will BTC Drop to $65K Before a Short Squeeze Toward $75K?

The post Bitcoin Price Prediction: Will BTC Drop to $65K Before a Short Squeeze Toward $75K? appeared first on Coinpedia Fintech News
Bitcoin price is once again stuck below the psychological $70,000 level, and the price action is starting to feel compressed.
After multiple attempts to reclaim the $69,500–$70,000 zone, BTC continues to face rejection. The repeated failures have increased short-term selling pressure, while leverage builds on both sides of the market. Open interest remains elevated, and funding has begun to shift, a sign that traders are positioning aggressively for the next move.
When leverage expands during tight consolidation, volatility usually follows. The real question now is simple: Will BTC price sweep liquidity below $65,000 first or break higher and squeeze shorts toward $75,000?
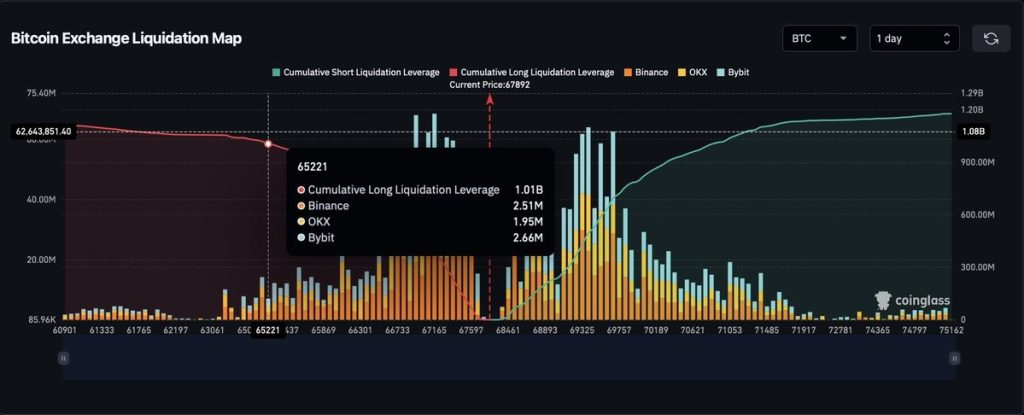
Bitcoin Liquidation Map Shows Heavy Liquidity at $65K and $72K–$75K
The Bitcoin exchange liquidation map reveals two major liquidity clusters: a dense long liquidation zone near $65,000–$64,000, and a growing short liquidation pocket between $72,000 and $75,000. Currently trading around $67,000–$68,000, BTC is sitting between these two liquidity pools, effectively trapped in what traders call a “liquidity sandwich.”
 Source: X
Markets tend to move toward the nearest and largest liquidity cluster first. In this case, the heavier and closer pool sits below the current price. That increases the probability of a move toward $65K to trigger long liquidations before any sustained rebound. However, once that liquidity is absorbed, the path toward the upside cluster opens, especially if short positions begin to stack above $70K. This setup favors volatility expansion in both directions.
Bitcoin Price Chart: Key Levels to Watch
On the short-term price chart, Bitcoin has already lost the 0.382 Fibonacci level near $67,200, indicating weakening momentum. The next technical level sits at 0.5 retracement: $65,700 and 0.618 retracement: $64,300. These align closely with the liquidation cluster below, reinforcing the idea that a sweep toward the $65K zone is technically and structurally reasonable.
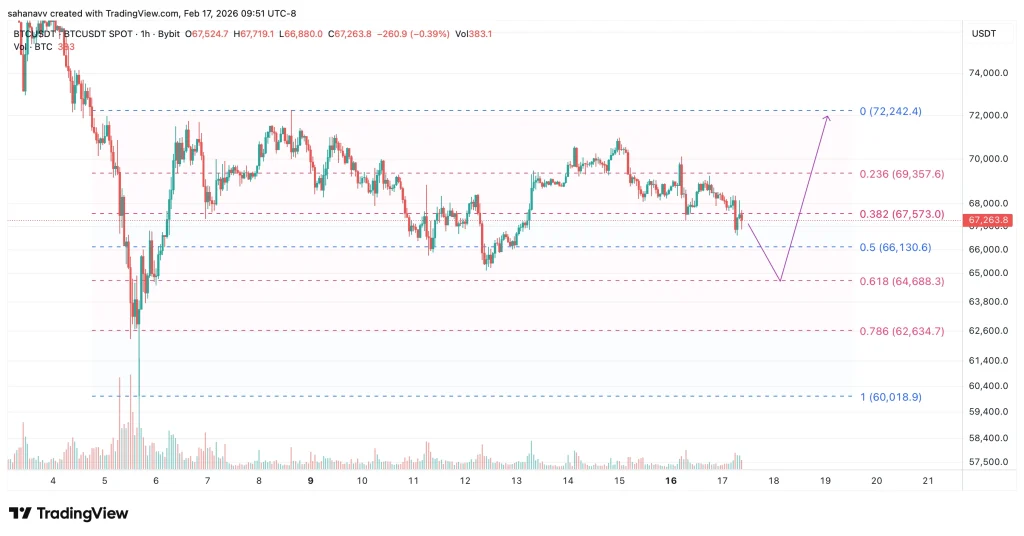
So far, BTC continues to print lower highs on the intraday timeframe. That keeps the short-term structure tilted bearish unless the price reclaims $70,000 with conviction.
In simple terms:
- Below $70K, sellers remain active
- Below $67K, downside liquidity becomes vulnerable
- Below $65K, cascade risk increases
Bullish Scenario: Liquidity Sweep Followed by a Short Squeeze Toward $75K
In the bullish case, Bitcoin first drops toward $65,000, triggering long liquidations and absorbing downside liquidity. If buyers step in aggressively at that level and funding resets, BTC could rebound sharply. A reclaim of $70,000 would likely trap late shorts and open the door toward the $72K–$75K short liquidation cluster.
A squeeze through $72K could accelerate momentum quickly, potentially pushing BTC toward $75,000 before facing fresh resistance. This scenario depends on strong spot buying near $65K, stabilizing open interest and short build-up above $70K.
Bearish Scenario: Breakdown Below $65K Extends the Correction
If $65,000 fails to hold, the setup changes materially. A decisive break below $64,000 (0.618 Fib) could trigger a deeper liquidation cascade. In that case, Bitcoin may extend toward the $62,000–$60,000 support region.
For this bearish continuation to unfold, selling pressure must remain persistent, and open interest would need to decline further without meaningful absorption. That would invalidate the short-squeeze thesis, at least temporarily.
Final Outlook: Bitcoin at a Liquidity Decision Point
Bitcoin is not trending cleanly right now; it is compressing between major liquidity zones. The market is building leverage on both sides, and that usually precedes sharp moves. The liquidation map suggests $65K is the nearest magnet. What happens there will likely determine whether the BTC price rallies toward $75K or slides into a deeper correction.
For now, $70,000 remains the immediate barrier, and $65,000 is the level that could trigger the next wave of volatility.


Potrebbe anche piacerti

Elon Musk trial on track as Washington securities case

OpenVPP accused of falsely advertising cooperation with the US government; SEC commissioner clarifies no involvement