

Chainlink ($LINK) Price to Make a Comeback? Analysts Weigh In
The LINK price is starting to catch traders’ interest again, and honestly, it makes sense. After months of grinding lower, Chainlink is now sitting right near the bottom of a major macro range, and that’s usually where things start getting interesting.
Crypto expert Lucky summed up the mood perfectly with a simple question: is $LINK quietly getting ready for a comeback? And when you look at the charts, it’s not hard to see why that idea is floating around again.
Monthly Chart Shows LINK Price Still Stuck in a Massive Range
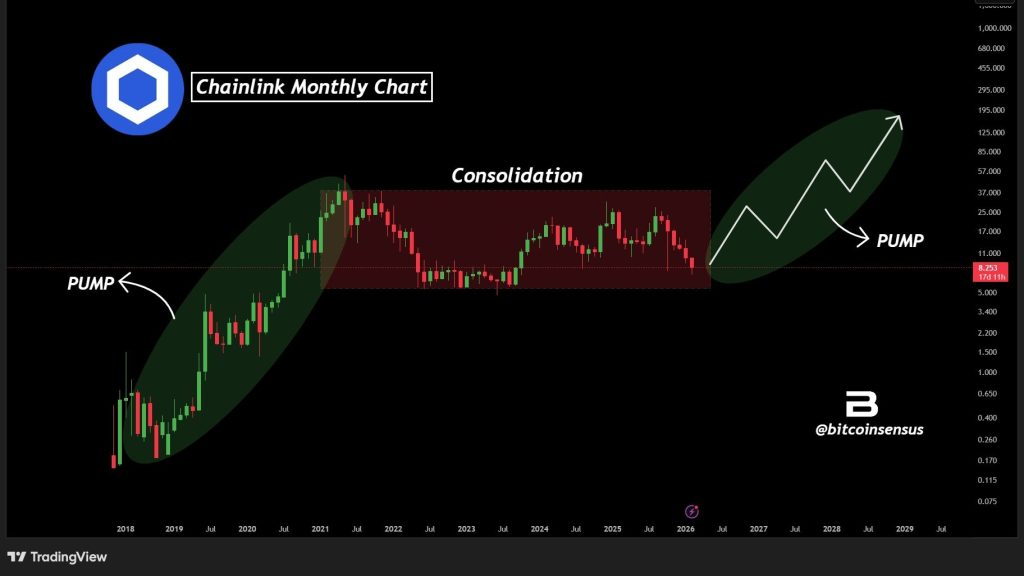
On the monthly timeframe, the LINK price has basically been trapped in a huge consolidation zone for years now. The chart shows that impulse move into the 2021 peak, followed by a long stretch of sideways action where price has been capped inside a broad range.
 Source: X/@Bitcoinsensus
The key detail is where LINK sits right now, near the lower end of that range. That’s important because these lower range zones are often where price compresses before the next major expansion phase begins.
Bitcoinsensus pointed out this same structure, calling it a macro consolidation that may be nearing its end. The idea is pretty simple: big impulse, long reset, then eventually the next wave higher once the range finally breaks.
Daily Chart: LINK Price Is Sitting Right in a Demand Zone
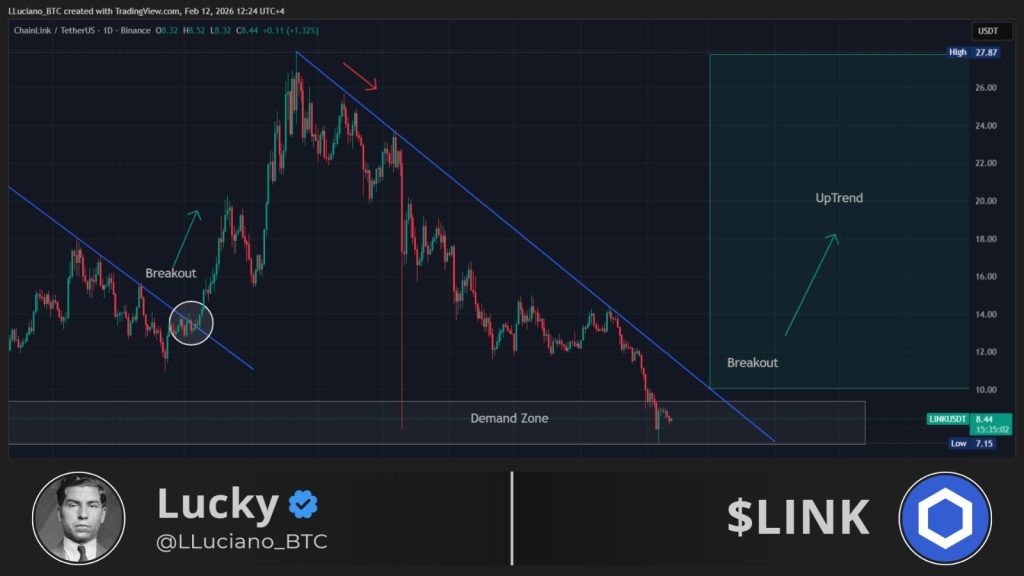
Zooming into the daily chart shared by Lucky, the LINK price is sitting inside a clear demand zone after months of downtrend pressure. That falling resistance line has controlled price for a long time, but now LINK is compressing right near support, which is usually where sellers start losing their grip.
 Source: X/@LLuciano_BTC
The chart also highlights a breakout area above the downtrend line, and if the LINK price can reclaim momentum and push out of this base, the upside starts opening up quickly. The target zone on the chart stretches toward the $20–$27 region, which would be a full recovery move back into the upper structure.
Read Also: Top Analyst Says Chainlink (LINK) Price Could 17x From Here – The $100 Chart Setup Explained
LINK Price Outlook: Quiet Setup or Something Bigger Brewing?
Right now, the LINK price is still in the “boring” phase of the cycle, that part where everything feels slow right before it stops being slow. Macro consolidation near range lows, compression on the daily chart, and a clear breakout trigger overhead are exactly the kind of setup traders like to spot early.
If LINK breaks out of its downtrend and starts reclaiming higher levels, this could turn into one of those comeback charts people only appreciate after the move is already gone. For now, Chainlink is sitting at a major decision point. And the next move could end up being a lot bigger than it looks today.
Subscribe to our YouTube channel for daily crypto updates, market insights, and expert analysis.
The post Chainlink ($LINK) Price to Make a Comeback? Analysts Weigh In appeared first on CaptainAltcoin.


Potrebbe anche piacerti

Bitcoin Price Analysis: Critical $60K-$75K Range Holds as Sellers Maintain Dominant Grip

President Trump Backs Crypto Market Structure Bill to Lock In New Rules
Kraken Unveils New Bitcoin Vault Offering 2.5% Annual BTC Returns


Notizie di tendenza
Altro
