

A long-term Bitcoin indicator tracked by analyst bitcoindata21 is close to flashing again, pointing to the possibility of another price surge. The signal is triggered whenever the market touches a yellow upward trendline that has historically marked the beginning of major rallies. This observation comes at a time of subdued sentiment in the crypto market, with growing fears of a bear phase that could see Bitcoin dip below the $100K level. Bitcoin is currently holding at $113,300, down 0.15% over the past day, while its weekly chart shows a 4.71% loss. Meanwhile, bitcoindata21 is offering hope for another round of green trading days based on technical analysis. Historical Precedent The accompanying chart shows multiple past instances when Bitcoin tagged this trendline, each followed by decisive upward momentum. Specifically, from early 2017 to 2021, and again in 2023, every contact with the line preceded meaningful gains. The analyst emphasized that the signal “has never failed so far.” In the current setup, Bitcoin is trading around $113,000, while the chart suggests the next touch of the trendline is imminent. The analyst is confident that history will repeat and that the event will serve as the trigger for the next leg higher. bitcoindata21's Bitcoin chart What to Expect from Bitcoin Commenting on bitcoindata21’s post, one X user remarked that the comeback could see Bitcoin hit $145,000. Notably, other market watchers are also using technical indicators to call for a rebound. At the same time, some believe there is still a risk of a significant dip. For instance, analyst CasiTrades has warned of a likely drop to $88K if Bitcoin bulls fail to maintain a price above the $122,000 level. CasiTrades, a technical analyst with over a decade of experience, believes Bitcoin completed Wave 1 of a corrective pattern at $112,500 and is now in a Wave 2 rebound. This bounce could push BTC toward the $119,900–$121,900 range, but failure to break higher may trigger a steep Wave 3 decline. However, if Bitcoin surpasses its $124,500 high, the bearish outlook would be invalidated. Meanwhile, Michael XBT, another veteran market watcher, believes calling for a major dump at this stage is premature. https://twitter.com/MichaelXBT/status/1958202430018953266 "Road to $1M BTC Remains Intact" Regardless of Bitcoin’s short-term patterns, there is almost a consensus regarding its long-term uptrend. Many expect Bitcoin to potentially experience a 10X price surge in the coming years. For instance, Coinbase CEO Brian Armstrong has joined other industry leaders in predicting that Bitcoin could reach $1 million within the next five years.A long-term Bitcoin indicator tracked by analyst bitcoindata21 is close to flashing again, pointing to the possibility of another price surge. The signal is triggered whenever the market touches a yellow upward trendline that has historically marked the beginning of major rallies. This observation comes at a time of subdued sentiment in the crypto market, with growing fears of a bear phase that could see Bitcoin dip below the $100K level. Bitcoin is currently holding at $113,300, down 0.15% over the past day, while its weekly chart shows a 4.71% loss. Meanwhile, bitcoindata21 is offering hope for another round of green trading days based on technical analysis. Historical Precedent The accompanying chart shows multiple past instances when Bitcoin tagged this trendline, each followed by decisive upward momentum. Specifically, from early 2017 to 2021, and again in 2023, every contact with the line preceded meaningful gains. The analyst emphasized that the signal “has never failed so far.” In the current setup, Bitcoin is trading around $113,000, while the chart suggests the next touch of the trendline is imminent. The analyst is confident that history will repeat and that the event will serve as the trigger for the next leg higher. bitcoindata21's Bitcoin chart What to Expect from Bitcoin Commenting on bitcoindata21’s post, one X user remarked that the comeback could see Bitcoin hit $145,000. Notably, other market watchers are also using technical indicators to call for a rebound. At the same time, some believe there is still a risk of a significant dip. For instance, analyst CasiTrades has warned of a likely drop to $88K if Bitcoin bulls fail to maintain a price above the $122,000 level. CasiTrades, a technical analyst with over a decade of experience, believes Bitcoin completed Wave 1 of a corrective pattern at $112,500 and is now in a Wave 2 rebound. This bounce could push BTC toward the $119,900–$121,900 range, but failure to break higher may trigger a steep Wave 3 decline. However, if Bitcoin surpasses its $124,500 high, the bearish outlook would be invalidated. Meanwhile, Michael XBT, another veteran market watcher, believes calling for a major dump at this stage is premature. https://twitter.com/MichaelXBT/status/1958202430018953266 "Road to $1M BTC Remains Intact" Regardless of Bitcoin’s short-term patterns, there is almost a consensus regarding its long-term uptrend. Many expect Bitcoin to potentially experience a 10X price surge in the coming years. For instance, Coinbase CEO Brian Armstrong has joined other industry leaders in predicting that Bitcoin could reach $1 million within the next five years.
Rare Bitcoin Bull Signal Nears Activation; Analyst Says It Has Never Failed
Per feedback o dubbi su questo contenuto, contattateci all'indirizzo crypto.news@mexc.com.
A long-term Bitcoin indicator tracked by analyst bitcoindata21 is close to flashing again, pointing to the possibility of another price surge. The signal is triggered whenever the market touches a yellow upward trendline that has historically marked the beginning of major rallies. This observation comes at a time of subdued sentiment in the crypto market, with growing fears of a bear phase that could see Bitcoin dip below the $100K level. Bitcoin is currently holding at $113,300, down 0.15% over the past day, while its weekly chart shows a 4.71% loss. Meanwhile, bitcoindata21 is offering hope for another round of green trading days based on technical analysis. Historical Precedent The accompanying chart shows multiple past instances when Bitcoin tagged this trendline, each followed by decisive upward momentum. Specifically, from early 2017 to 2021, and again in 2023, every contact with the line preceded meaningful gains. The analyst emphasized that the signal “has never failed so far.” In the current setup, Bitcoin is trading around $113,000, while the chart suggests the next touch of the trendline is imminent. The analyst is confident that history will repeat and that the event will serve as the trigger for the next leg higher. 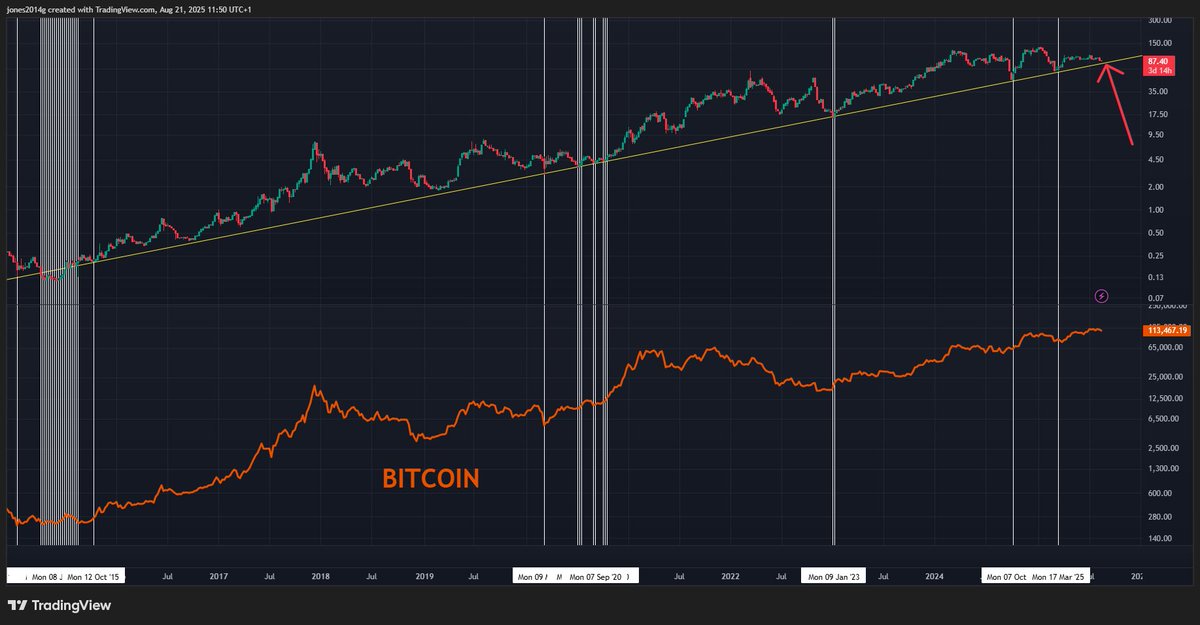 bitcoindata21's Bitcoin chart What to Expect from Bitcoin Commenting on bitcoindata21’s post, one X user remarked that the comeback could see Bitcoin hit $145,000. Notably, other market watchers are also using technical indicators to call for a rebound. At the same time, some believe there is still a risk of a significant dip. For instance, analyst CasiTrades has warned of a likely drop to $88K if Bitcoin bulls fail to maintain a price above the $122,000 level. CasiTrades, a technical analyst with over a decade of experience, believes Bitcoin completed Wave 1 of a corrective pattern at $112,500 and is now in a Wave 2 rebound. This bounce could push BTC toward the $119,900–$121,900 range, but failure to break higher may trigger a steep Wave 3 decline. However, if Bitcoin surpasses its $124,500 high, the bearish outlook would be invalidated. Meanwhile, Michael XBT, another veteran market watcher, believes calling for a major dump at this stage is premature. https://twitter.com/MichaelXBT/status/1958202430018953266 "Road to $1M BTC Remains Intact" Regardless of Bitcoin’s short-term patterns, there is almost a consensus regarding its long-term uptrend. Many expect Bitcoin to potentially experience a 10X price surge in the coming years. For instance, Coinbase CEO Brian Armstrong has joined other industry leaders in predicting that Bitcoin could reach $1 million within the next five years.
bitcoindata21's Bitcoin chart What to Expect from Bitcoin Commenting on bitcoindata21’s post, one X user remarked that the comeback could see Bitcoin hit $145,000. Notably, other market watchers are also using technical indicators to call for a rebound. At the same time, some believe there is still a risk of a significant dip. For instance, analyst CasiTrades has warned of a likely drop to $88K if Bitcoin bulls fail to maintain a price above the $122,000 level. CasiTrades, a technical analyst with over a decade of experience, believes Bitcoin completed Wave 1 of a corrective pattern at $112,500 and is now in a Wave 2 rebound. This bounce could push BTC toward the $119,900–$121,900 range, but failure to break higher may trigger a steep Wave 3 decline. However, if Bitcoin surpasses its $124,500 high, the bearish outlook would be invalidated. Meanwhile, Michael XBT, another veteran market watcher, believes calling for a major dump at this stage is premature. https://twitter.com/MichaelXBT/status/1958202430018953266 "Road to $1M BTC Remains Intact" Regardless of Bitcoin’s short-term patterns, there is almost a consensus regarding its long-term uptrend. Many expect Bitcoin to potentially experience a 10X price surge in the coming years. For instance, Coinbase CEO Brian Armstrong has joined other industry leaders in predicting that Bitcoin could reach $1 million within the next five years.Opportunità di mercato
Valore Bitcoin (BTC)
$68,483.47
$68,483.47$68,483.47
USD
Grafico dei prezzi in tempo reale di Bitcoin (BTC)


Disclaimer: gli articoli ripubblicati su questo sito provengono da piattaforme pubbliche e sono forniti esclusivamente a scopo informativo. Non riflettono necessariamente le opinioni di MEXC. Tutti i diritti rimangono agli autori originali. Se ritieni che un contenuto violi i diritti di terze parti, contatta crypto.news@mexc.com per la rimozione. MEXC non fornisce alcuna garanzia in merito all'accuratezza, completezza o tempestività del contenuto e non è responsabile per eventuali azioni intraprese sulla base delle informazioni fornite. Il contenuto non costituisce consulenza finanziaria, legale o professionale di altro tipo, né deve essere considerato una raccomandazione o un'approvazione da parte di MEXC.
Potrebbe anche piacerti

WLD Price Prediction: Oversold Bounce Could Target $0.30 by May 2026
Worldcoin (WLD) trades at $0.24 with RSI at 29.53 signaling oversold conditions. Technical analysis suggests potential bounce to $0.26-$0.30 range if support holds
Condividi
BlockChain News2026/04/08 01:22

Top Crypto to Buy Right Now: BlockDAG, Ethereum, Avalanche, Hyperliquid, and Tron Offer Big Moves
The digital asset market in April 2026 is moving quickly, and choosing the right option at the correct moment is vital. With values changing every day and major
Condividi
Timestabloid2026/04/08 01:00

FLOKI Price Prediction: Technical Consolidation Suggests $0.000035 Target by May 2026
FLOKI trades at $0.000027 with neutral RSI at 42.50. Technical analysis points to potential 30% upside if resistance breaks, targeting $0.000035 by May 2026. (Read
Condividi
BlockChain News2026/04/08 01:40


