

Bitcoin Price Bounce Looks Hollow, Downtrend May Resume
Bitcoin price extended its decline below $75,000. BTC is now attempting to recover from $72,850 but faces many hurdles near $76,500.
- Bitcoin is attempting to recover above $74,000 and $75,000.
- The price is trading below $79,000 and the 100 hourly simple moving average.
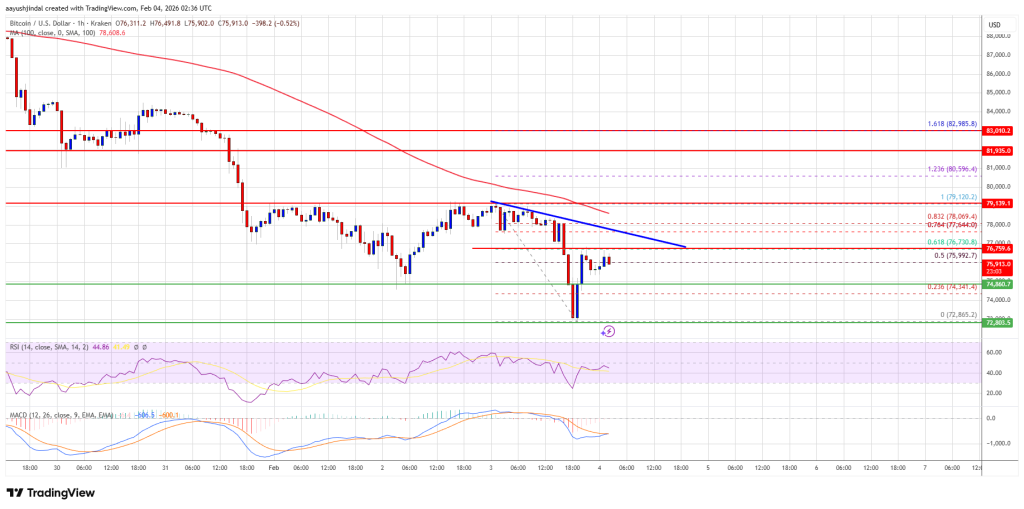
- There is a bearish trend line forming with resistance at $77,200 on the hourly chart of the BTC/USD pair (data feed from Kraken).
- The pair might dip again if it trades below the $75,000 and $74,000 levels.
Bitcoin Price Faces Hurdles
Bitcoin price failed to remain stable above the $76,000 zone. BTC extended its decline below the $75,000 and $74,000 levels. The bears were able to push the price below $73,500.
A low was formed at $72,865, and the price is now attempting to recover. There was a move above $75,000. The price surpassed the 50% Fib retracement level of the downward move from the $79,120 swing high to the $72,865 low.
However, the bears are active near $77,000 and the 61.8% Fib retracement level of the downward move from the $79,120 swing high to the $72,865 low. Bitcoin is now trading below $77,000 and the 100 hourly simple moving average.
If the price remains stable above $75,000, it could attempt a fresh increase. Immediate resistance is near the $76,750 level. The first key resistance is near the $77,000 level. There is also a bearish trend line forming with resistance at $77,200 on the hourly chart of the BTC/USD pair.
A close above the $77,200 resistance might send the price further higher. In the stated case, the price could rise and test the $78,500 resistance. Any more gains might send the price toward the $79,000 level. The next barrier for the bulls could be $80,000 and $80,500.
Another Decline In BTC?
If Bitcoin fails to rise above the $77,200 resistance zone, it could start another decline. Immediate support is near the $75,000 level. The first major support is near the $74,000 level.
The next support is now near the $72,850 zone. Any more losses might send the price toward the $71,500 support in the near term. The main support sits at $70,000, below which BTC might struggle to recover in the near term.
Technical indicators:
Hourly MACD – The MACD is now gaining pace in the bearish zone.
Hourly RSI (Relative Strength Index) – The RSI for BTC/USD is now below the 50 level.
Major Support Levels – $75,000, followed by $74,000.
Major Resistance Levels – $76,750 and $77,200.


Potrebbe anche piacerti

Fake Promises and Fraud: Inside the Mosciun NFT Scam That Cost Holders $4 Million

Dogecoin and Hyperliquid Are Heating Up — But This New Project Might Be the One to Watch


