

Solana price shows bearish divergence at $146 as breakdown risk builds
Solana price is flashing bearish divergence at $146 range-high resistance, signaling weakening momentum and increasing the probability of a pullback toward lower range support levels.
- SOL failed to reclaim $146 range-high resistance
- Bearish RSI divergence signals momentum is weakening at the top
- A break below Point of Control opens downside toward $117 support
Solana’s (SOL) recent price action is showing early warning signs after failing to reclaim the $146 range-high resistance. While price has attempted to push higher, momentum is beginning to weaken beneath the surface, and the chart is now displaying a clean bearish divergence, a classic reversal signal that often appears near major resistance zones.
Solana price key technical points
- Solana is capped beneath $146 range-high resistance
- Price printed a bearish divergence, signaling weakening momentum
- A break below the Point of Control opens downside toward $117 support
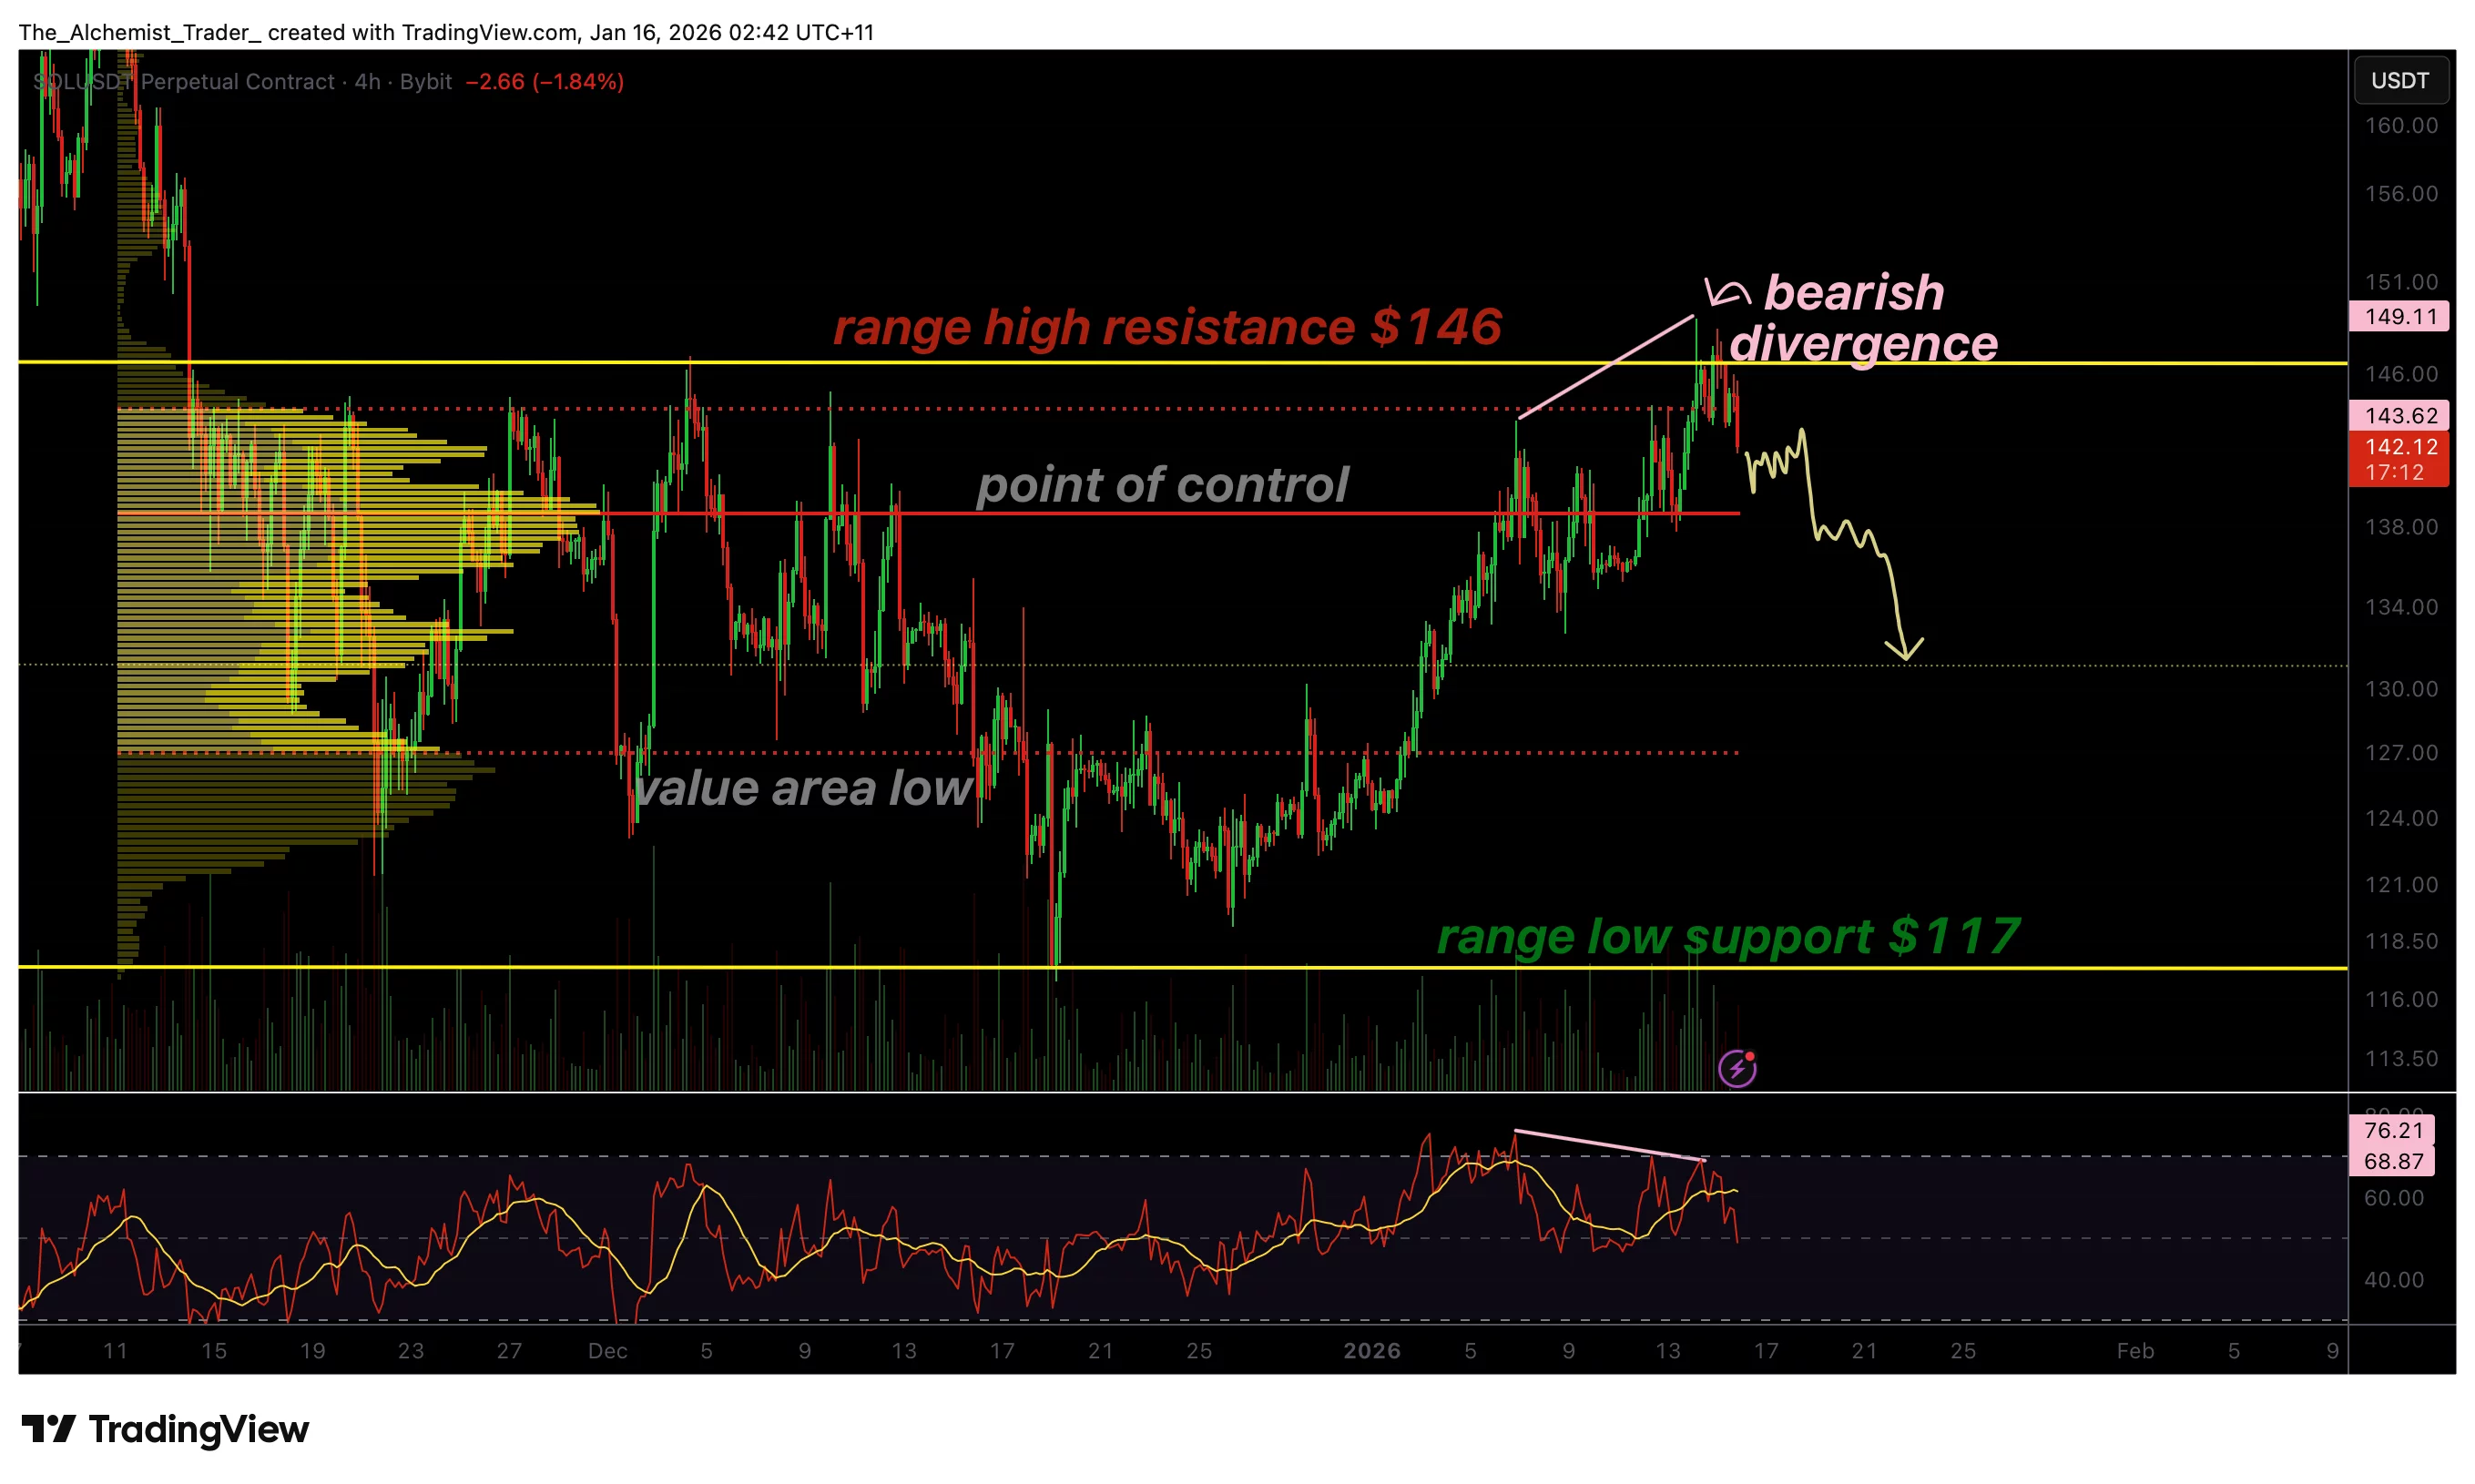
Bearish divergence occurs when price prints a higher high while momentum indicators, such as the RSI, print a lower high (or lower reading), signaling that upside strength is fading even as price attempts to extend. In Solana’s case, this divergence has formed cleanly near the $146 resistance zone.
This matters because divergences are not random. They often appear when upside momentum is being driven by fewer participants, or when buyers are losing strength as they approach a key supply area. In many cases, price can still push higher briefly after divergence forms, but the signal highlights increasing vulnerability to rejection once selling pressure enters.
The fact that Solana has been unable to reclaim $146 and is printing divergence at that level strengthens the bearish case. It suggests the market is struggling to sustain continuation and that sellers are likely defending the range high.
$146 range high resistance remains the key ceiling
From a market-structure perspective, the $146 level remains a decisive level. Range highs act as major resistance boundaries in consolidation environments, and repeated failure to reclaim the upper boundary often results in rotational moves lower.
Solana’s inability to close above $146 reinforces the idea that supply is present at higher prices. In strong breakout conditions, price typically clears resistance with impulsive candles and expanding volume. When price stalls and prints weakening momentum signals instead, it often suggests the move higher is running out of fuel.
As long as SOL remains below this resistance, the breakout probability decreases and the likelihood of another corrective rotation increases.
Point of control is the key breakdown trigger
The next major level that determines downside continuation is the Point of Control (POC). The POC represents the price level at which the greatest volume has traded within the range. It often acts as a pivotal balance point: when price holds above it, structure remains more stable; when price breaks below it, downside continuation becomes more likely.
For Solana, a break below the POC would confirm that value is shifting lower and would strengthen the bearish divergence signal. This is because divergence alone does not guarantee a breakdown; it signals weakness, but confirmation often comes through structural failure at key support zones.
If Solana loses the POC on a closing basis, it would solidify the idea that buyers are losing control and that the market is transitioning from range resistance into range rotation lower.
Downside target: $117 high-time-frame support
If the POC breaks, the next major downside objective becomes the $117 high-time-frame support, which aligns with the lower boundary of the broader trading range. This level represents the next area where demand is likely to step in and where the market may attempt to stabilize.
A rotation toward $117 would be consistent with Solana remaining within the range it has traded in for the past few months. Range structures often cycle between resistance and support multiple times before a decisive breakout occurs. With divergence printing at the top of the range, a move toward range support becomes the more natural technical expectation.
It is important to note that a move to $117 does not automatically imply macro bearish continuation. Instead, it would reflect the market’s tendency to rotate and rebalance within the range until a strong breakout occurs, supported by volume and directional acceptance.
What to expect in the coming price action
In the near term, Solana’s bearish divergence at $146 indicates that upside momentum is weakening and rejection risk is rising. If SOL remains capped below range-high resistance and breaks below the Point of Control, the probability increases for a deeper corrective move toward $117 support.


Potrebbe anche piacerti
Ethereum Price Prediction – ETH Price Estimated to Reach $ 2,305.39 By May 27, 2026

New Fed Chair Sworn In; Rate-Cut Odds at 0 Shape Crypto Regulation

Ethereum’s Identity Crisis Deepens After High-Profile Brain Drain Frustrates the Community


Notizie di tendenza
Altro
