

Bitcoin Price Prediction This Week: Break Above $100K or Pullback Toward $88K First?

The post Bitcoin Price Prediction This Week: Break Above $100K or Pullback Toward $88K First? appeared first on Coinpedia Fintech News
Bitcoin price traded in a tight range over the weekend, absorbing selling pressure while defending the critical $90,000 support zone. The rebound from this level was backed by strong buying volume, allowing BTC to open the week on a firmer note and push back toward its immediate resistance area. This recovery has sparked renewed optimism, with traders questioning why Bitcoin is rising today and whether a move toward $100,000 could unfold in the near term.
However, with technical indicators showing signs of near-term exhaustion. Market participants are closely watching whether BTC may first dip below $90,000 before attempting a sustained rally toward the six-figure mark.
What Caused the Bitcoin Price Surge?
Bitcoin’s latest move higher was driven by a sharp shift in global risk sentiment. The BTC price gained momentum after Nasdaq futures slid nearly 0.8%, while gold pushed to a fresh high. This followed amid escalating tensions between U.S. President Donald Trump and Federal Reserve Chair Jerome Powell. Trump accused Powell of politically motivated rate decisions, undermining confidence in traditional markets. As uncertainty grew, investors rotated into Bitcoin as a hedge against central-bank politicisation, mirroring gold’s safe-haven appeal.
The rally was further supported by a notable decline in the U.S. dollar index, a historically bullish signal for BTC. Adding to the momentum, Tether froze $182 million in suspicious USDT transfers. This is its largest single-day action since 2023 to reduce liquidity for coordinated sell-offs. Similar events in the past have preceded strong short-term Bitcoin rallies, raising expectations of further upside.
What’s Next—Will BTC Push Higher to $95,000?
Since defending the critical $88,000 support zone, Bitcoin has entered a phase of tight consolidation, keeping both bulls and bears in check. While buyers have yet to assert strong dominance, sellers have also failed to force a breakdown below key levels. Price action now reflects growing compression, with BTC trading within an ascending triangle formation. The recent rebound from the rising support trendline suggests mounting bullish pressure, raising expectations of a decisive move above the local resistance range.
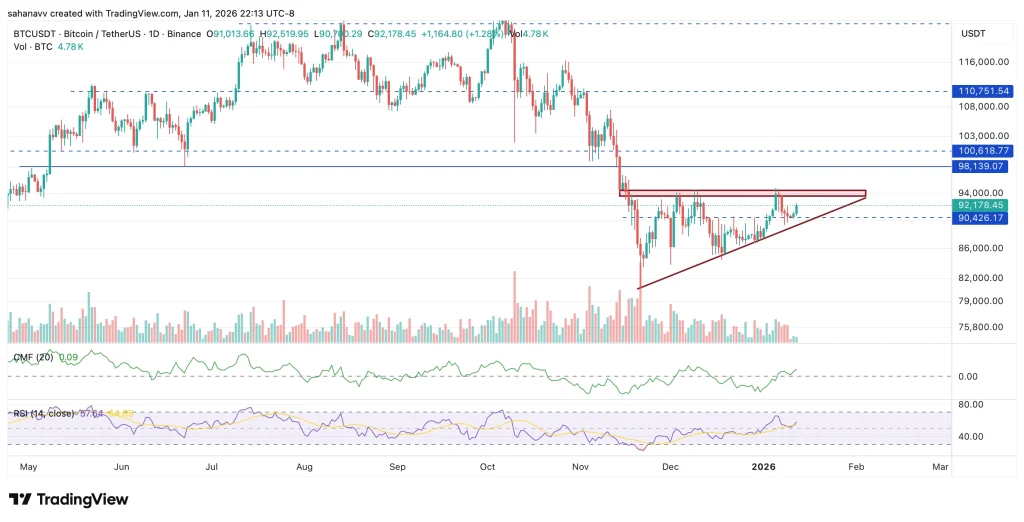
The chart shows Bitcoin coiling within an ascending triangle, marked by higher lows and a flat resistance zone near $94,000–$95,000. This structure typically reflects accumulation, where buyers step in earlier on each dip. The CMF remains positive, signaling steady capital inflows, while the RSI holds above neutral, indicating improving momentum without overbought conditions. However, repeated rejections at resistance highlight the seller’s presence. A confirmed breakout above the triangle could open the path toward $100,000, while failure to hold the rising support risks a retest of $88,000 before any upside continuation.
When Can Bitcoin Reach $100K?
For Bitcoin to reach the $100,000 mark, a clear shift from consolidation to expansion is required. A daily close above the $94,000–$95,000 resistance zone, backed by rising volume and sustained positive money flow, would confirm a breakout from the ascending triangle and open the path toward the psychological $100K level. This move is more likely if broader risk sentiment remains supportive and the U.S. dollar continues to weaken. However, failure to hold the rising trendline could delay the rally, triggering a pullback toward $88,000 before any renewed upside attempt.


Potrebbe anche piacerti


