Bitcoin price eyes multi-year breakout as ETF inflows hit $1.3 billion
Currently, the Bitcoin price is holding steady above $105,000 on Saturday as exchange-traded funds data show investors bought Friday’s dip.
Bitcoin (BTC) rose to $105,300, up by 2.4% from its lowest point on Friday, and 5% above this month’s lowest point.
SoSoValue data shows that spot Bitcoin ETFs saw inflows of $301 million on Friday, even as Bitcoin’s price dropped to nearly $100,000. This pushed total weekly ETF inflows to $1.3 billion—a sharp reversal from the previous week’s $128 million in outflows.
BlackRock’s iShares Bitcoin ETF, whose ticker symbol is IBIT, had daily inflows of $238 million on Friday, bringing its cumulative figure to $49.7 billion. It now has $70 billion in assets, making it the fastest-growing ETF in finance.
The SPDR Gold Trust, which was launched in 2004, has accumulated $103 billion in assets. This means that IBIT may flip the biggest gold ETF in the next few months or in 2026 if the trend continues.
Fidelity’s FBTC ETF has had over $11 billion in inflows, while Bitwise’s BITB has had $2 billion since inception.
A possible reason why Wall Street investors bought Bitcoin’s dip is that it maintains strong fundamentals. BlackRock’s data shows that Bitcoin beats the stock market after a major geopolitical event such as the Iran and Israel attacks.
Bitcoin’s supply on exchanges has plunged from 1.5 million in January to 1.1 million today. Falling Bitcoin supplies at a time of falling supplies will likely boost the price in the long term.
Bitcoin price long-term chart point to a multi-year breakout
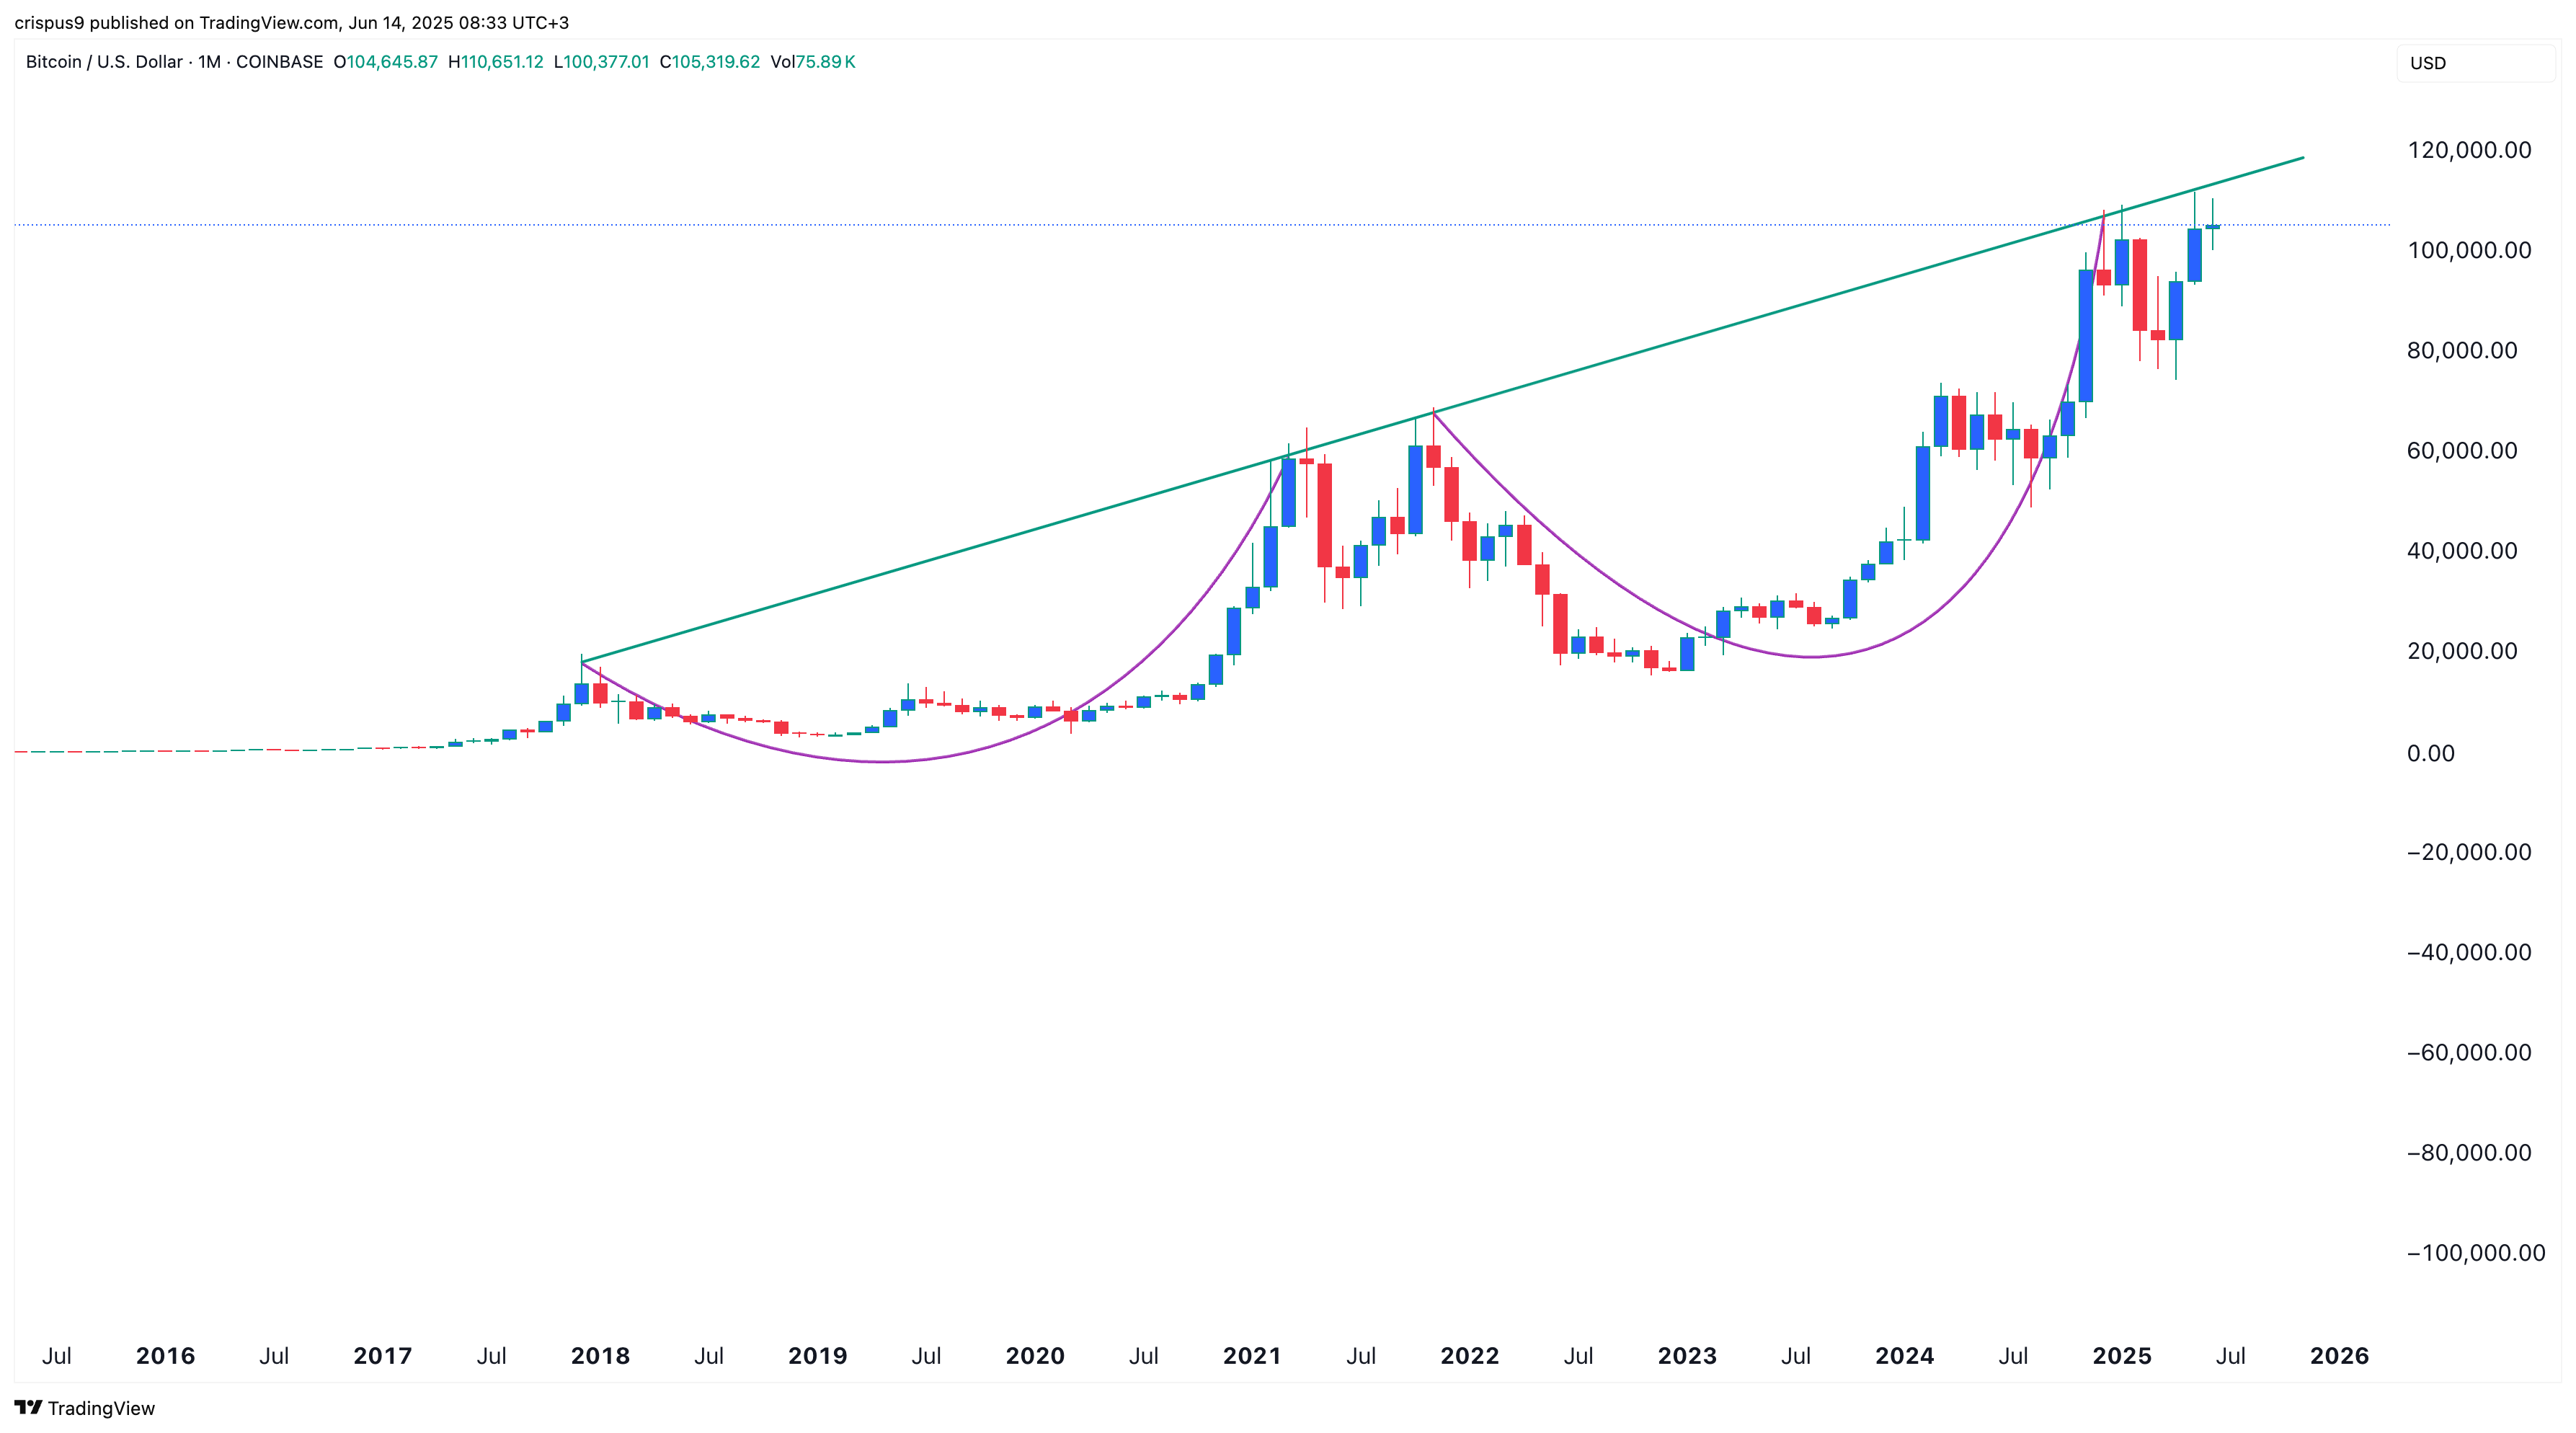
The monthly chart indicates a strong Bitcoin price breakout in the near term. This chart shows that Bitcoin formed a rounded bottom between Dec. 17 and March 2021.
Since November 2021, Bitcoin has been forming another rounded bottom. The price remains slightly below the ascending trendline connecting the upper side of these rounded bottoms.
Therefore, the coin may be about to exit an eight-year trendline, which could push it much higher in the long term. Ark Invest sees Bitcoin soaring to $2.4 million by 2030, while Michael Saylor has a mid-term forecast of $1 million.


Potrebbe anche piacerti
Republicans deploy ground troops in the states to execute 'the plan'
GOP Senate hopeful under fire over ties to church rocked by child sex abuse scandal