

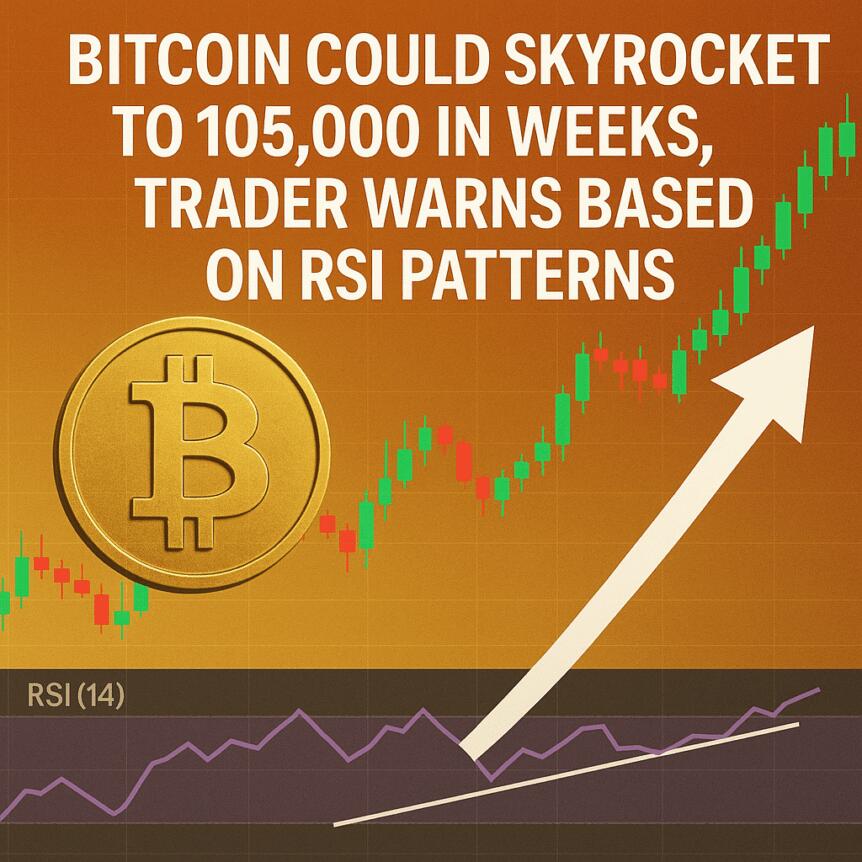
Bitcoin Could Skyrocket to $105,000 in Weeks, Trader Warns Based on RSI Patterns
Bitcoin Price Outlook: RSI Signals Hint at Potential Surge to $105,000
Recent technical analysis highlights a bullish shift in Bitcoin’s momentum indicators, suggesting a possible rally towards $105,000 within weeks. Despite some trader caution, multiple timeframes show promising signals that could bolster the leading cryptocurrency’s price trajectory amid consolidation.
Key Takeaways
- Bitcoin is displaying bullish RSI signals across several timeframes, indicating increasing buying momentum.
- A significant weekly RSI breakout has sustained since December, confirming a trend shift from prior downtrend patterns.
- Market sentiment remains mixed; some traders caution about potential new lows before a sustained rebound.
- Order book data suggests active US-based buyers are providing support, though selling pressure persists at specific levels.
RSI Breakout Fuels $105,000 Target
Trading insights indicate that Bitcoin’s weekly relative strength index (RSI) is underpinning a bullish outlook. On Thursday, trader BitBull highlighted an ongoing breakout on the weekly RSI chart, which has remained steady since December, signaling a potential reversal from the prior downtrend that began in September.
“Bitcoin’s weekly RSI is signaling more upside as it broke out of its three-month downtrend and is holding above the breakout line,” said BitBull. The pattern resembles a previous rally last year that followed local lows of around $75,000, with projections now suggesting Bitcoin could reach between $103,000 and $105,000 within three to four weeks.
Bitcoin/USDT weekly chart with RSI data. Source: BitBull/XFurther reinforcing bullish momentum, James Easton, host of the DeCRYPTion podcast, pointed out that Bitcoin’s two-week RSI is at lower levels than during the last full bear market in late 2022 and has recently flipped bullish.
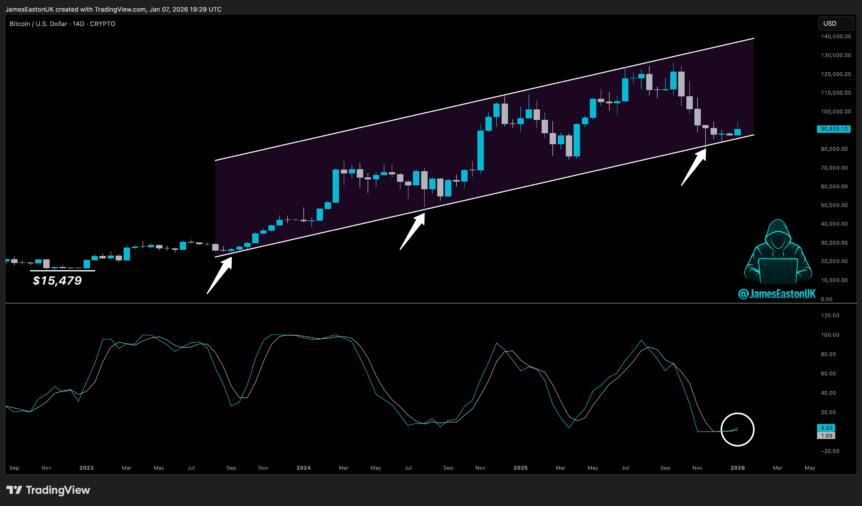 Bitcoin/USD two-week chart with RSI data. Source: James Easton/X
On shorter timeframes, technical signals remain encouraging. A four-hour chart reveals a potential hidden bullish divergence, where RSI forms lower lows while price maintains higher lows. This divergence suggests weakening selling pressure and supports a potential move to establish $90,000 as a robust support zone.
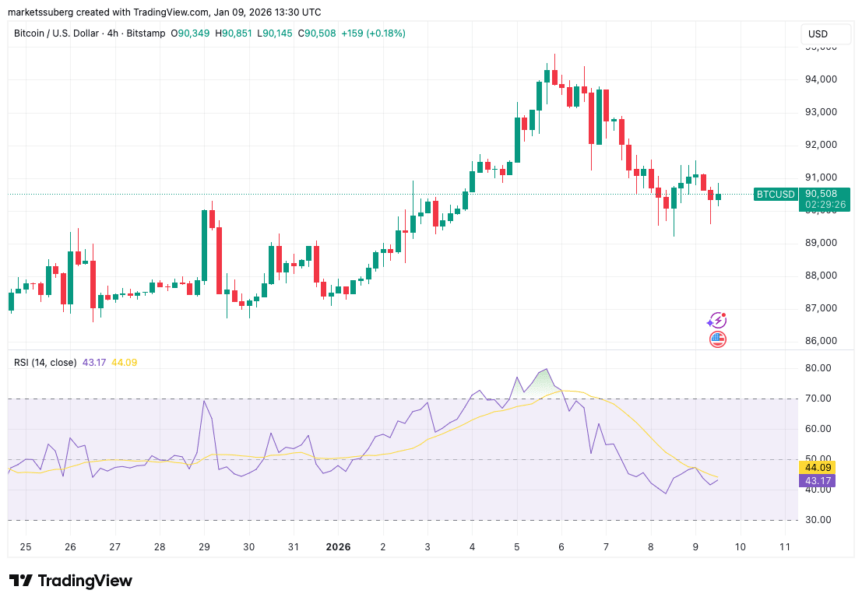 Bitcoin/USD four-hour chart with RSI data. Source: Cointelegraph/TradingView
Market Sentiment: US Buyers and Resistance Levels
Despite technical optimism, traders remain cautious. Market analysis shows active buying from US traders around $91,500, with order book data revealing passive sellers at this level. These sellers, quoting small batches of Bitcoin, suggest that buy pressure during the US session is a key support factor but also indicate ongoing resistance at higher levels.
Analysis from Skew underscores the presence of US-based buyers as a critical element in counteracting prevailing sell pressure. Nonetheless, some analysts caution that Bitcoin may revisit lower support levels, including the April lows near $75,000, especially if resistance on the upside remains formidable.
Overall, technical indicators suggest that while Bitcoin is poised for potential gains, market participants should remain vigilant, as volatility and resistance levels continue to shape short-term price action.
This article was originally published as Bitcoin Could Skyrocket to $105,000 in Weeks, Trader Warns Based on RSI Patterns on Crypto Breaking News – your trusted source for crypto news, Bitcoin news, and blockchain updates.


Potrebbe anche piacerti

Graham calls out opponents for refusing to fire workers behind racist content

Jen Psaki shreds Trump's 'insane' threats in on-air takedown: 'A last straw for many'


