

Bitcoin Analyst PlanB Signals Possible 10x Upside

Bitcoin ($BTC) analyst PlanB has flagged what he believes is a major valuation disconnect between Bitcoin and traditional assets, suggesting the deviation could set the stage for a sharp upside move. In a recent post on X, PlanB argued that Bitcoin is trading far below its historical relationship with both stocks and gold. He noted that Bitcoin’s current price near $87,500 sits well beneath long-term regression trends when compared with the S&P 500 and gold, a setup he says has appeared only once before.
PlanB Links Current Bitcoin Divergence to Stock-to-Flow Scarcity Dynamics
According to PlanB, a similar divergence occurred when Bitcoin was trading below $1,000, shortly before it rallied by roughly 10x. While he cautioned that correlations can break and outcomes are never guaranteed, he stressed that the current positioning stands out from a historical perspective.
PlanB, best known for creating the Stock-to-Flow (S2F) model, views Bitcoin as a scarce asset whose value is driven by supply dynamics similar to commodities like gold. Although the model has faced criticism in recent years for missing cycle peaks, it remains widely followed across the crypto market.
PlanB Argues Bitcoin Has Never Been Permanently Uncorrelated
Responding to criticism that Bitcoin should remain uncorrelated from traditional markets, PlanB reiterated his long-held view that assets with real scarcity tend to rise together during periods of monetary debasement. He added that Bitcoin’s correlations have never been static and have shifted across different market cycles.
Bitcoin has traded sideways in recent weeks following its October peak, leading to debate over whether the asset is consolidating before another leg higher or entering a prolonged cooling phase. For now, PlanB maintains that the current divergence is notable and deserves close attention. In the end, he summed up that only time will tell what happens.


Potrebbe anche piacerti
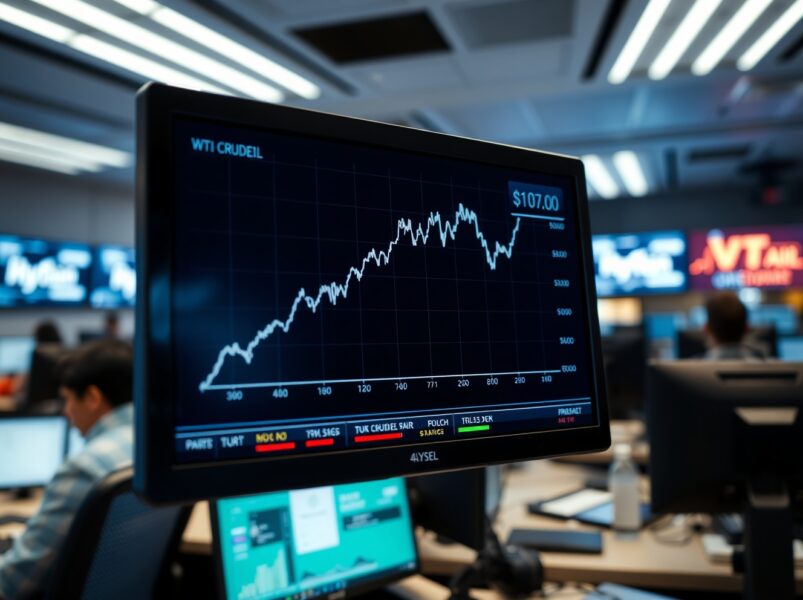
WTI Crude Oil Soars: Price Nears $105 Amid Critical Iran Infrastructure Threats

Best Crypto to Buy Now as Algorand Jumps 15% and Pepeto Nears Listing


