

AAVE Slips Toward $150 as Daily Chart Signals Rising Bearish Pressure Ahead
- AAVE price nears $150 as sellers maintain steady control.
- Daily indicators warn of sustained bearish momentum building.
- Support pressure grows as volatility signals cautious trading ahead.
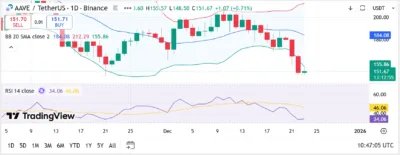
AAVE attracted market attention after sliding closer to the $150 level on the daily chart. Price action against USDT reflected increasing bearish pressure as sellers extended control. The move unfolded without extreme volatility, yet technical signals leaned clearly toward caution.
Recent trading showed AAVE changing hands around $151.67. This level placed the token near the lower Bollinger Band around $155.86. Consequently, price traded below the 20 day average near $184.08, highlighting sustained downside momentum. The upper band near $212.29 remained distant, underscoring the broader pullback.
Meanwhile, daily candles showed strong red closes with limited recovery attempts. Sellers consistently defended higher levels, preventing price stabilization above short-term resistance. However, smaller candle bodies near $150 suggested slowing momentum rather than renewed selling aggression. This behavior often signals temporary balance between buyers and sellers. RSI readings reinforced the bearish tone. The 14 period RSI hovered near 34.06, staying below neutral territory. Additionally, the RSI moving average near 46.06 reflected fading bullish strength. Hence, momentum conditions favored sellers while stopping short of extreme oversold signals.
Volatility patterns also shaped sentiment. Earlier Bollinger Band expansion preceded the sharp decline, suggesting increased participation. As price approached the lower band, volatility appeared to compress slightly. Besides, such compression often precedes consolidation rather than immediate reversals.
Importantly, the $150 region emerged as a short-term psychological zone. Market participants monitored this area closely, given its proximity to recent lows. A sustained hold could slow downside momentum. Conversely, a clear break might invite additional selling pressure.
Source: Tradingview
Also Read: 20,000,000 XRP in One Day Draws Attention – Here’s What’s Happening
Market Outlook and Technical Focus
From a broader market view, AAVE remained under its key moving average. This structure kept bearish bias intact across short-term strategies. Consequently, recovery attempts faced resistance near $160 and stronger pressure closer to $180. Additionally, RSI staying below 40 often aligns with continued weakness during downtrends. However, markets frequently pause when selling intensity declines near support. Therefore, traders weighed the risk of further losses against potential stabilization.
Correlation with the wider decentralized finance sector also mattered. Weak sentiment across related tokens often amplifies downside moves. Nevertheless, AAVE maintained steady liquidity, limiting abrupt dislocations. Technical traders focused on Bollinger Band interaction. Trading near the lower band suggested stretched conditions. While not a reversal signal, it often encourages range-bound behavior. Hence, expectations shifted toward consolidation unless fresh catalysts emerged.
Short-term sentiment remained cautious as indicators failed to confirm recovery strength. Price structure, momentum readings, and volatility measures aligned toward defensive positioning. AAVE’s drift toward $150 reflected growing bearish pressure on the daily chart. Technical indicators signaled weakness without panic, keeping traders alert as support levels faced critical tests.
Also Read: Ghana Ends Crypto Arrest Fears as New Law Brings $3B Digital Market Into the Open
The post AAVE Slips Toward $150 as Daily Chart Signals Rising Bearish Pressure Ahead appeared first on 36Crypto.


Potrebbe anche piacerti

Up To $10,000 Per Person Heading to Victims of Massive Cybersecurity Attack on Tech Firm

Aave CEO Reveals Upcoming Protocol Upgrades Set for Q4 2025 Launch


