Coinbase Monthly Outlook: Liquidity inflection point has arrived, Bitcoin may bottom out in the coming weeks
Author: David Duong , CFA - Global Head of Research
Compiled by: Tim, PANews
Market conditions in recent weeks have shaken our confidence in the more positive outlook for Q1 2025 (a view previously expressed in December 2024) as tighter liquidity and macro uncertainty erode investor confidence. Market consensus currently seems to be generally pessimistic, as reflected in the total market value of cryptocurrencies falling below pre-US election levels and the sharp drop in perpetual contract funding rates. We do believe that the speed and magnitude of this market correction has confused many investors.
The current pessimistic market sentiment is mainly driven by concerns about the unstable trajectory of economic activity, especially after many investors have been overly focused on the "American Exceptionalism 2.0" narrative in recent months. In the case of the crypto market, the momentum of the special positive factors seems to have slowed down, which has made many market players anxious. However, we believe that the current pessimism is an important signal that the market may bottom in the coming weeks, setting us up for new highs later in the year.
Note: American Exceptionalism is one of the core ideologies throughout American history, advocating that the United States is unique and even superior to other countries in terms of political system, values, development path, etc. This concept has not only shaped the national identity of the United States, but also profoundly influenced its domestic and foreign policies.
Global liquidity is beginning to recover, and the decline in real and nominal interest rates should ultimately help reduce borrowing costs. We also believe that long-term trends are likely to continue to support global growth in the future. That being said, we believe that it will be difficult for the crypto market to rebound effectively before traditional risk assets recover, so we are closely watching the US stock market for capitulation signals. Compared with survey data, the earnings season (April) may be a more accurate measure of the true situation of US consumers. We will continue to maintain an optimistic outlook for the second quarter of 2025, but we recommend that investors maintain a neutral stance on risk assets for now.
When will the bottom be reached?
Despite the recent positive developments in the cryptocurrency sector, such as the repeal of SAB 121 and the formal establishment of the Bitcoin Strategic Reserve, the crypto market has remained weak since the beginning of the year. In addition, the SEC recently withdrew several lawsuits against several crypto entities (including Coinbase), and the Stablecoin Innovation and User Security Act may be submitted to the U.S. House of Representatives and Senate for deliberation in the summer of 2025.
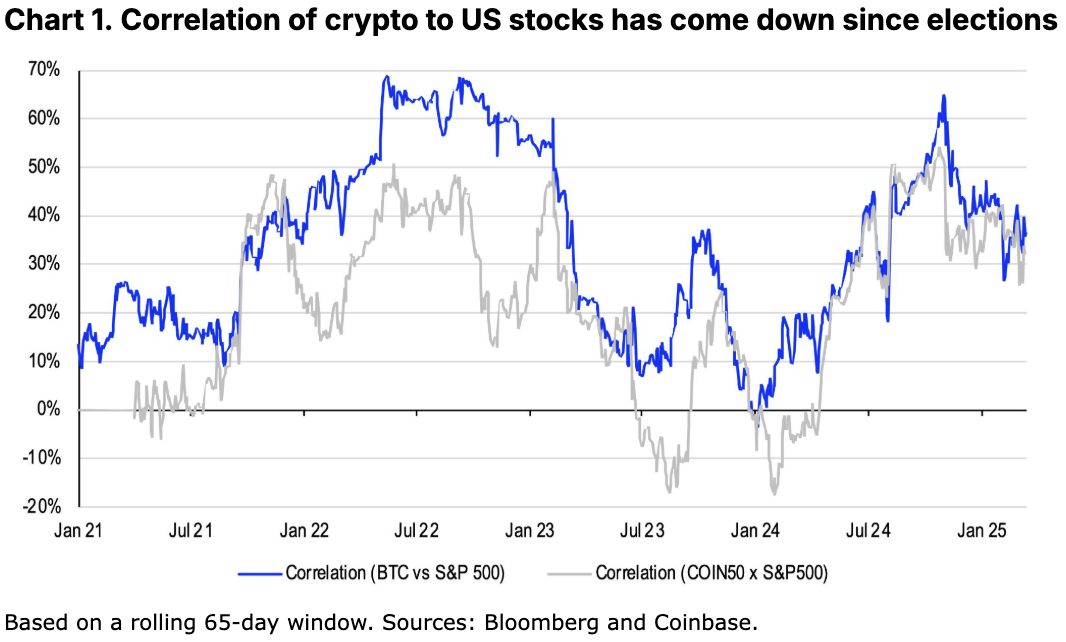
Despite the positive regulatory news, many market players are concerned about the weakening of the catalyst effect unique to the crypto space. This has led to macro factors becoming the dominant force, and the correlation between the crypto market and the US stock market is increasing. Indeed, the recent correlation between traditional risk assets and the crypto market has clearly shown that our previous optimistic expectations for the first quarter of 2025 were clearly misjudged.
Fears of a sharp slowdown or even recession in the U.S. economy have caused sentiment to take a sharp turn for the worse, answering the question we asked in our previous monthly outlook: whether market participants will view the impact of tariffs as inflationary or deflationary. Expectations for the federal funds rate have now shifted from pricing in just one rate cut in 2025 to three.
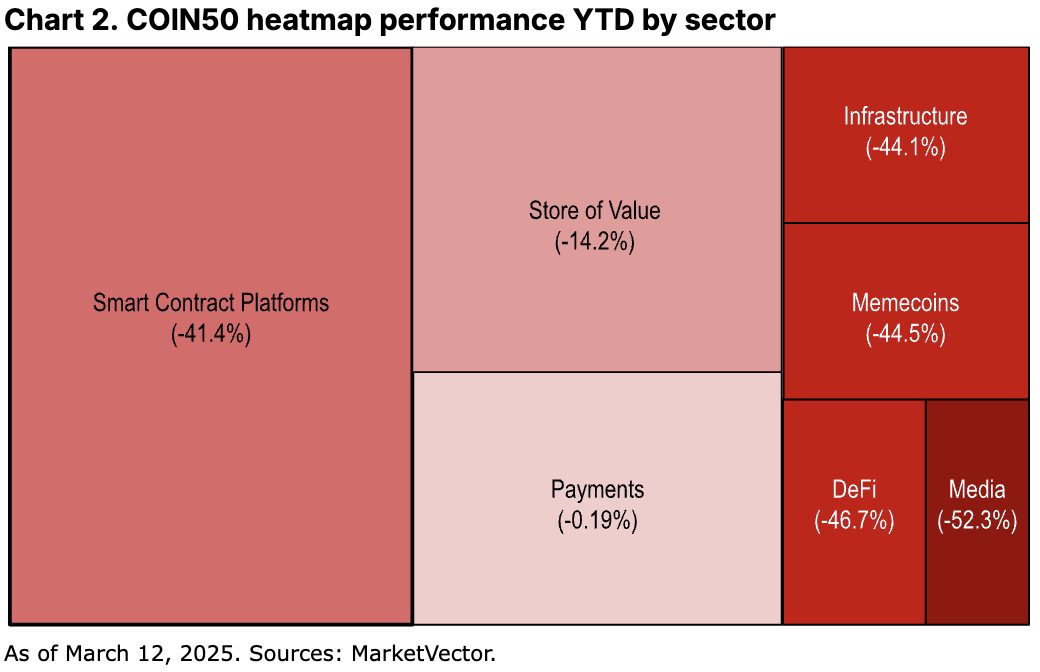
This round of selling has caused our Coinbase 50 (COIN50) index to fall 25.5% since the beginning of the year, and the total market value of the crypto market has evaporated by $532 billion. Interestingly, with the exception of the media and entertainment sector, the impact of market fluctuations on the various sub-sectors within the index is not significantly different. DeFi, Memecoin and infrastructure sectors have all experienced similar levels of sharp corrections. This phenomenon highlights the current widespread risk aversion in the entire market, and there is no selective consideration of the fundamentals and revenue capabilities of different projects.
Overall, we believe that this quarter may be the low point of crypto asset prices in 2025, as structural positive news such as tax cuts, regulatory relaxation and other stimulative fiscal policies may be implemented later this year. The current stablecoin balance has climbed to US$229 billion (data source: DeFiLlama), indicating that a large number of investors are turning to stablecoins for safe-haven operations, pushing the market value of stablecoins to 8.5% of the total market value of the crypto market (all increased from 6.3% at the beginning of the year). In addition, we believe that long-term trends such as artificial intelligence are expected to deliver on their promise to improve economic productivity in the near future.
Cognitive Bias
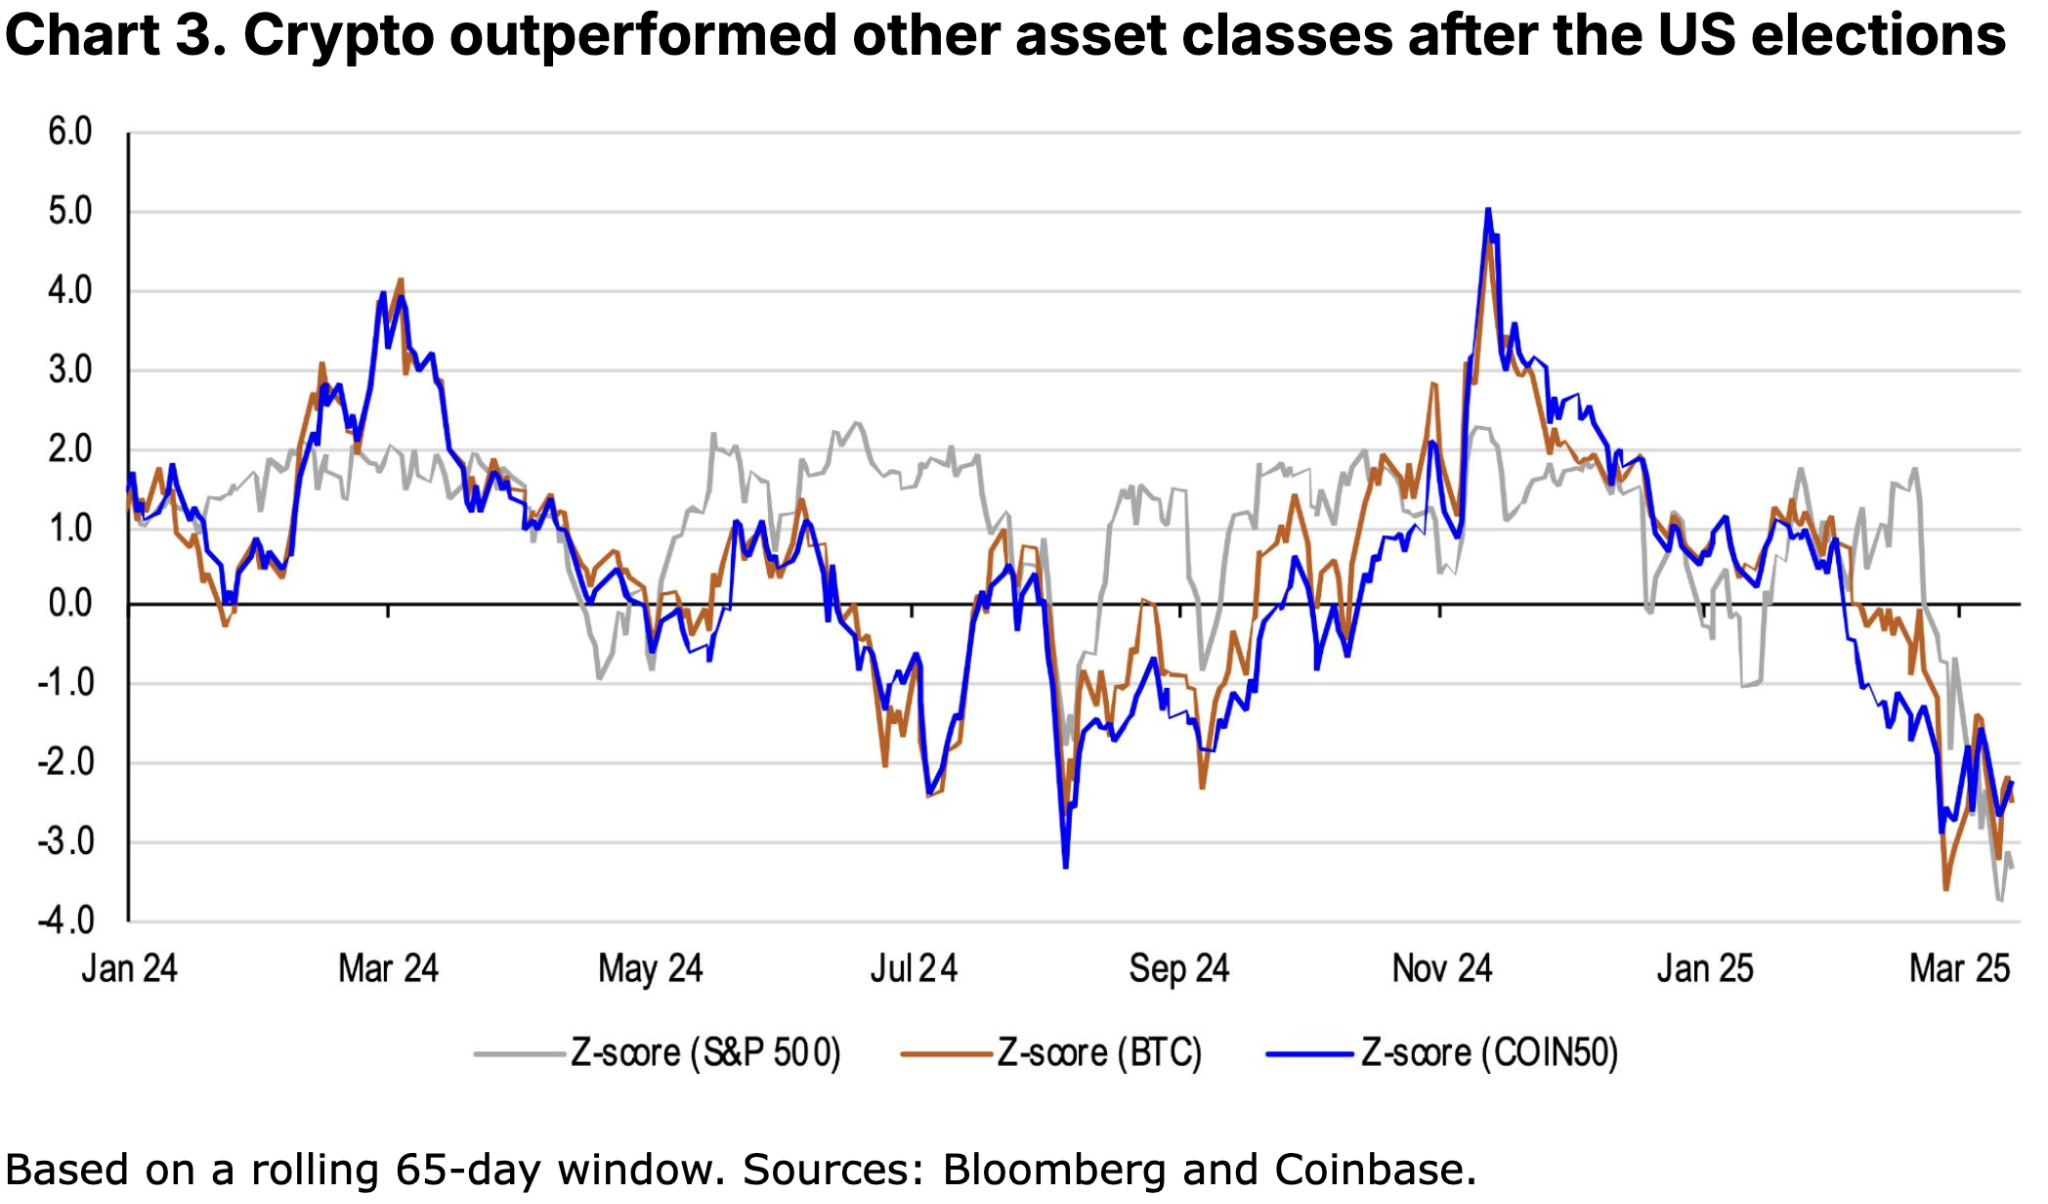
In addition, we do not believe that the weak performance of cryptocurrencies in recent weeks is an abnormal deviation from today's macro-tightening conditions. Instead, the real deviation is reflected in the performance difference between crypto assets and traditional risk assets from November 2024 (US election) to January 20, 2025 (presidential inauguration). Although the liquidity environment has gradually tightened since the second half of 2024, the market price represented by the COIN50 index has accumulated more than 67% during this period (see Figure 3 for details).
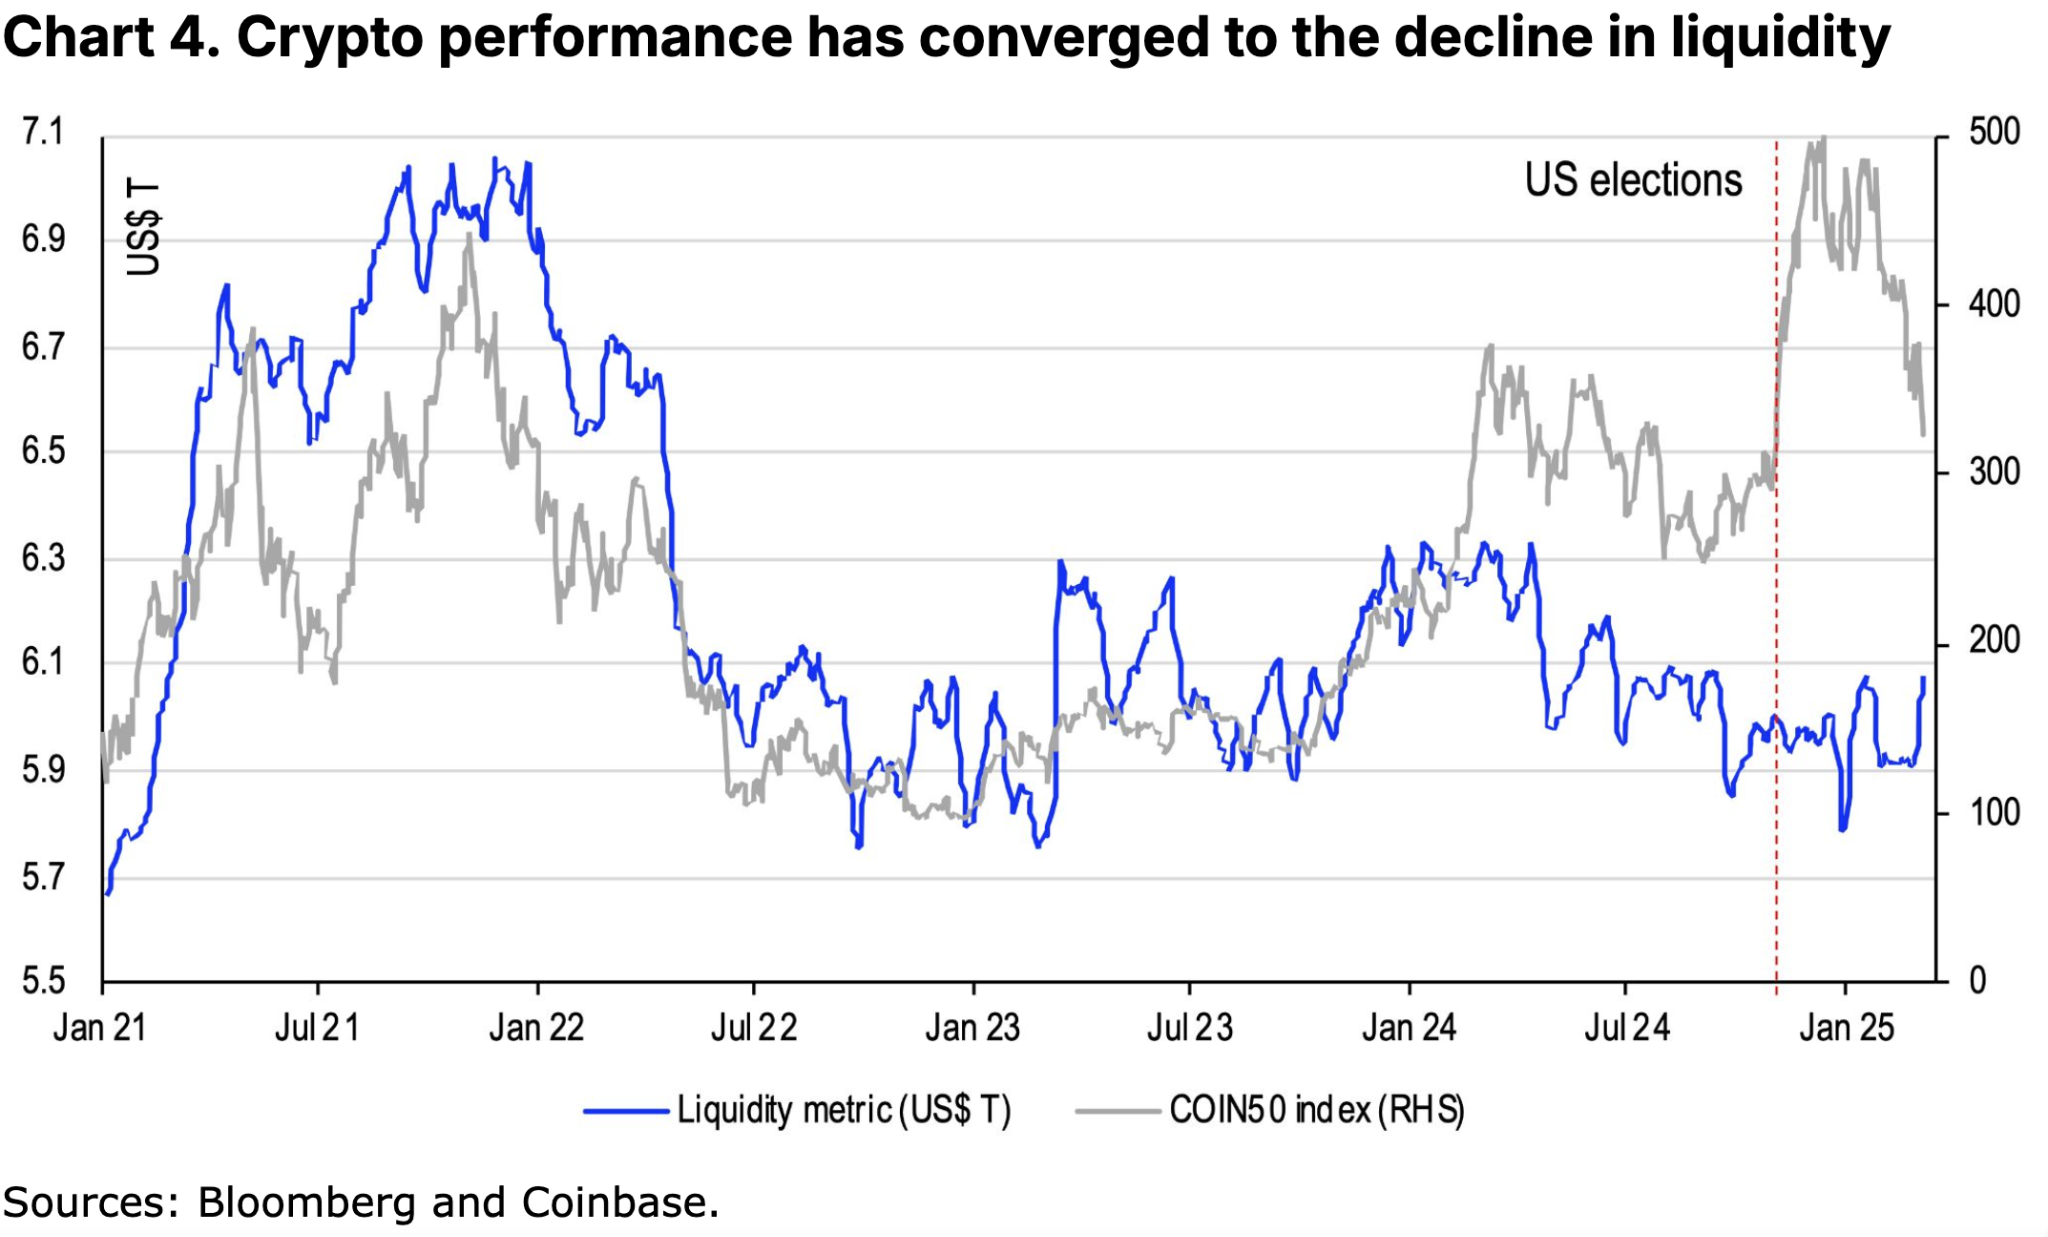
If we focus on the total assets of the Fed's balance sheet, minus the reverse repos and the Treasury General Account (TGA) balance, and use this as an indicator of market liquidity, this indicator has dropped from $6.2 trillion at the beginning of June 2024 to nearly $5.7 trillion at the beginning of 2025, a drop of more than $500 billion (see Figure 4). Generally speaking, the expansion of the Fed's balance sheet will inject liquidity into the market, while reverse repo operations will help absorb excess liquidity in the banking system, and an increase in the TGA balance will reduce the level of available cash in the financial system.
Liquidity is the lifeblood of any market, as it directs savings to borrowers by promoting greater investor participation, leverage, and price discovery. Conversely, liquidity contraction tends to inhibit trading activity and may lead to sharp price fluctuations. However, despite the continued decline in liquidity in the second half of 2024, the core factor triggering the sharp fluctuations in crypto asset prices lies in the market's expectation of a major shift in the US regulatory environment - the US election represents a key event with a relatively binary outcome for investors. We believe that the recent sell-off in the crypto market largely reflects a return to the trend of low liquidity.
In our view, this may be a potential positive news. In the past two months, the balance of the US Treasury General Account (TGA) has dropped from $745 billion at the end of 2024 to $500 billion on March 12, and this reduction has brought liquidity back to above $6 trillion. In addition, the current level of bank reserves is close to 10-11% of GDP, which is generally considered to be sufficient to maintain financial stability, which means that the Federal Reserve may decide to suspend or end quantitative tightening as early as the Federal Open Market Committee (FOMC) meeting on March 18-19.
All these signs indicate that market liquidity may be returning. The 10-year U.S. Treasury yield is expected to fall further, as U.S. Treasury Secretary Benson has made it clear that the current administration is committed to lowering long-term interest rates. We think it is best not to question his policy determination. From the perspective of the Fed model, falling yields will increase the discounted value of future cash flows of risky assets such as stocks, and this effect may also drive up crypto asset prices.
Summarize
Cryptocurrency markets have faced significant challenges in the near term due to increased volatility and macroeconomic uncertainty. Nevertheless, we continue to believe that accelerated regulation and increased institutional participation provide a more optimistic outlook in the coming months. In addition, as liquidity has eased after nearly six months of tightening, crypto asset prices may bottom out faster than most market participants expect. Therefore, we take a constructive stance on crypto markets in the second quarter of 2025. Nevertheless, short-term positive catalysts are still limited and it is best to remain cautious at this stage.


Potrebbe anche piacerti

Iran Rejects US Proposal, Submits Counter-Offer Demanding Sanctions Relief and War Reparations

Trump accused of handing massive gift to tobacco donors who couldn't win it legally