Ondo crypto outlook: can ONDOUSDT stabilize after a bearish phase?

After weeks of pressure, interest in Ondo crypto is rising again as traders look for signs that the recent drawdown could be slowing. However, the charts show a market still dominated by sellers, with short-term speculation occasionally clashing with a heavier, longer-term setup. In this piece we explore where the pair stands now and which technical levels could shape the next big move.
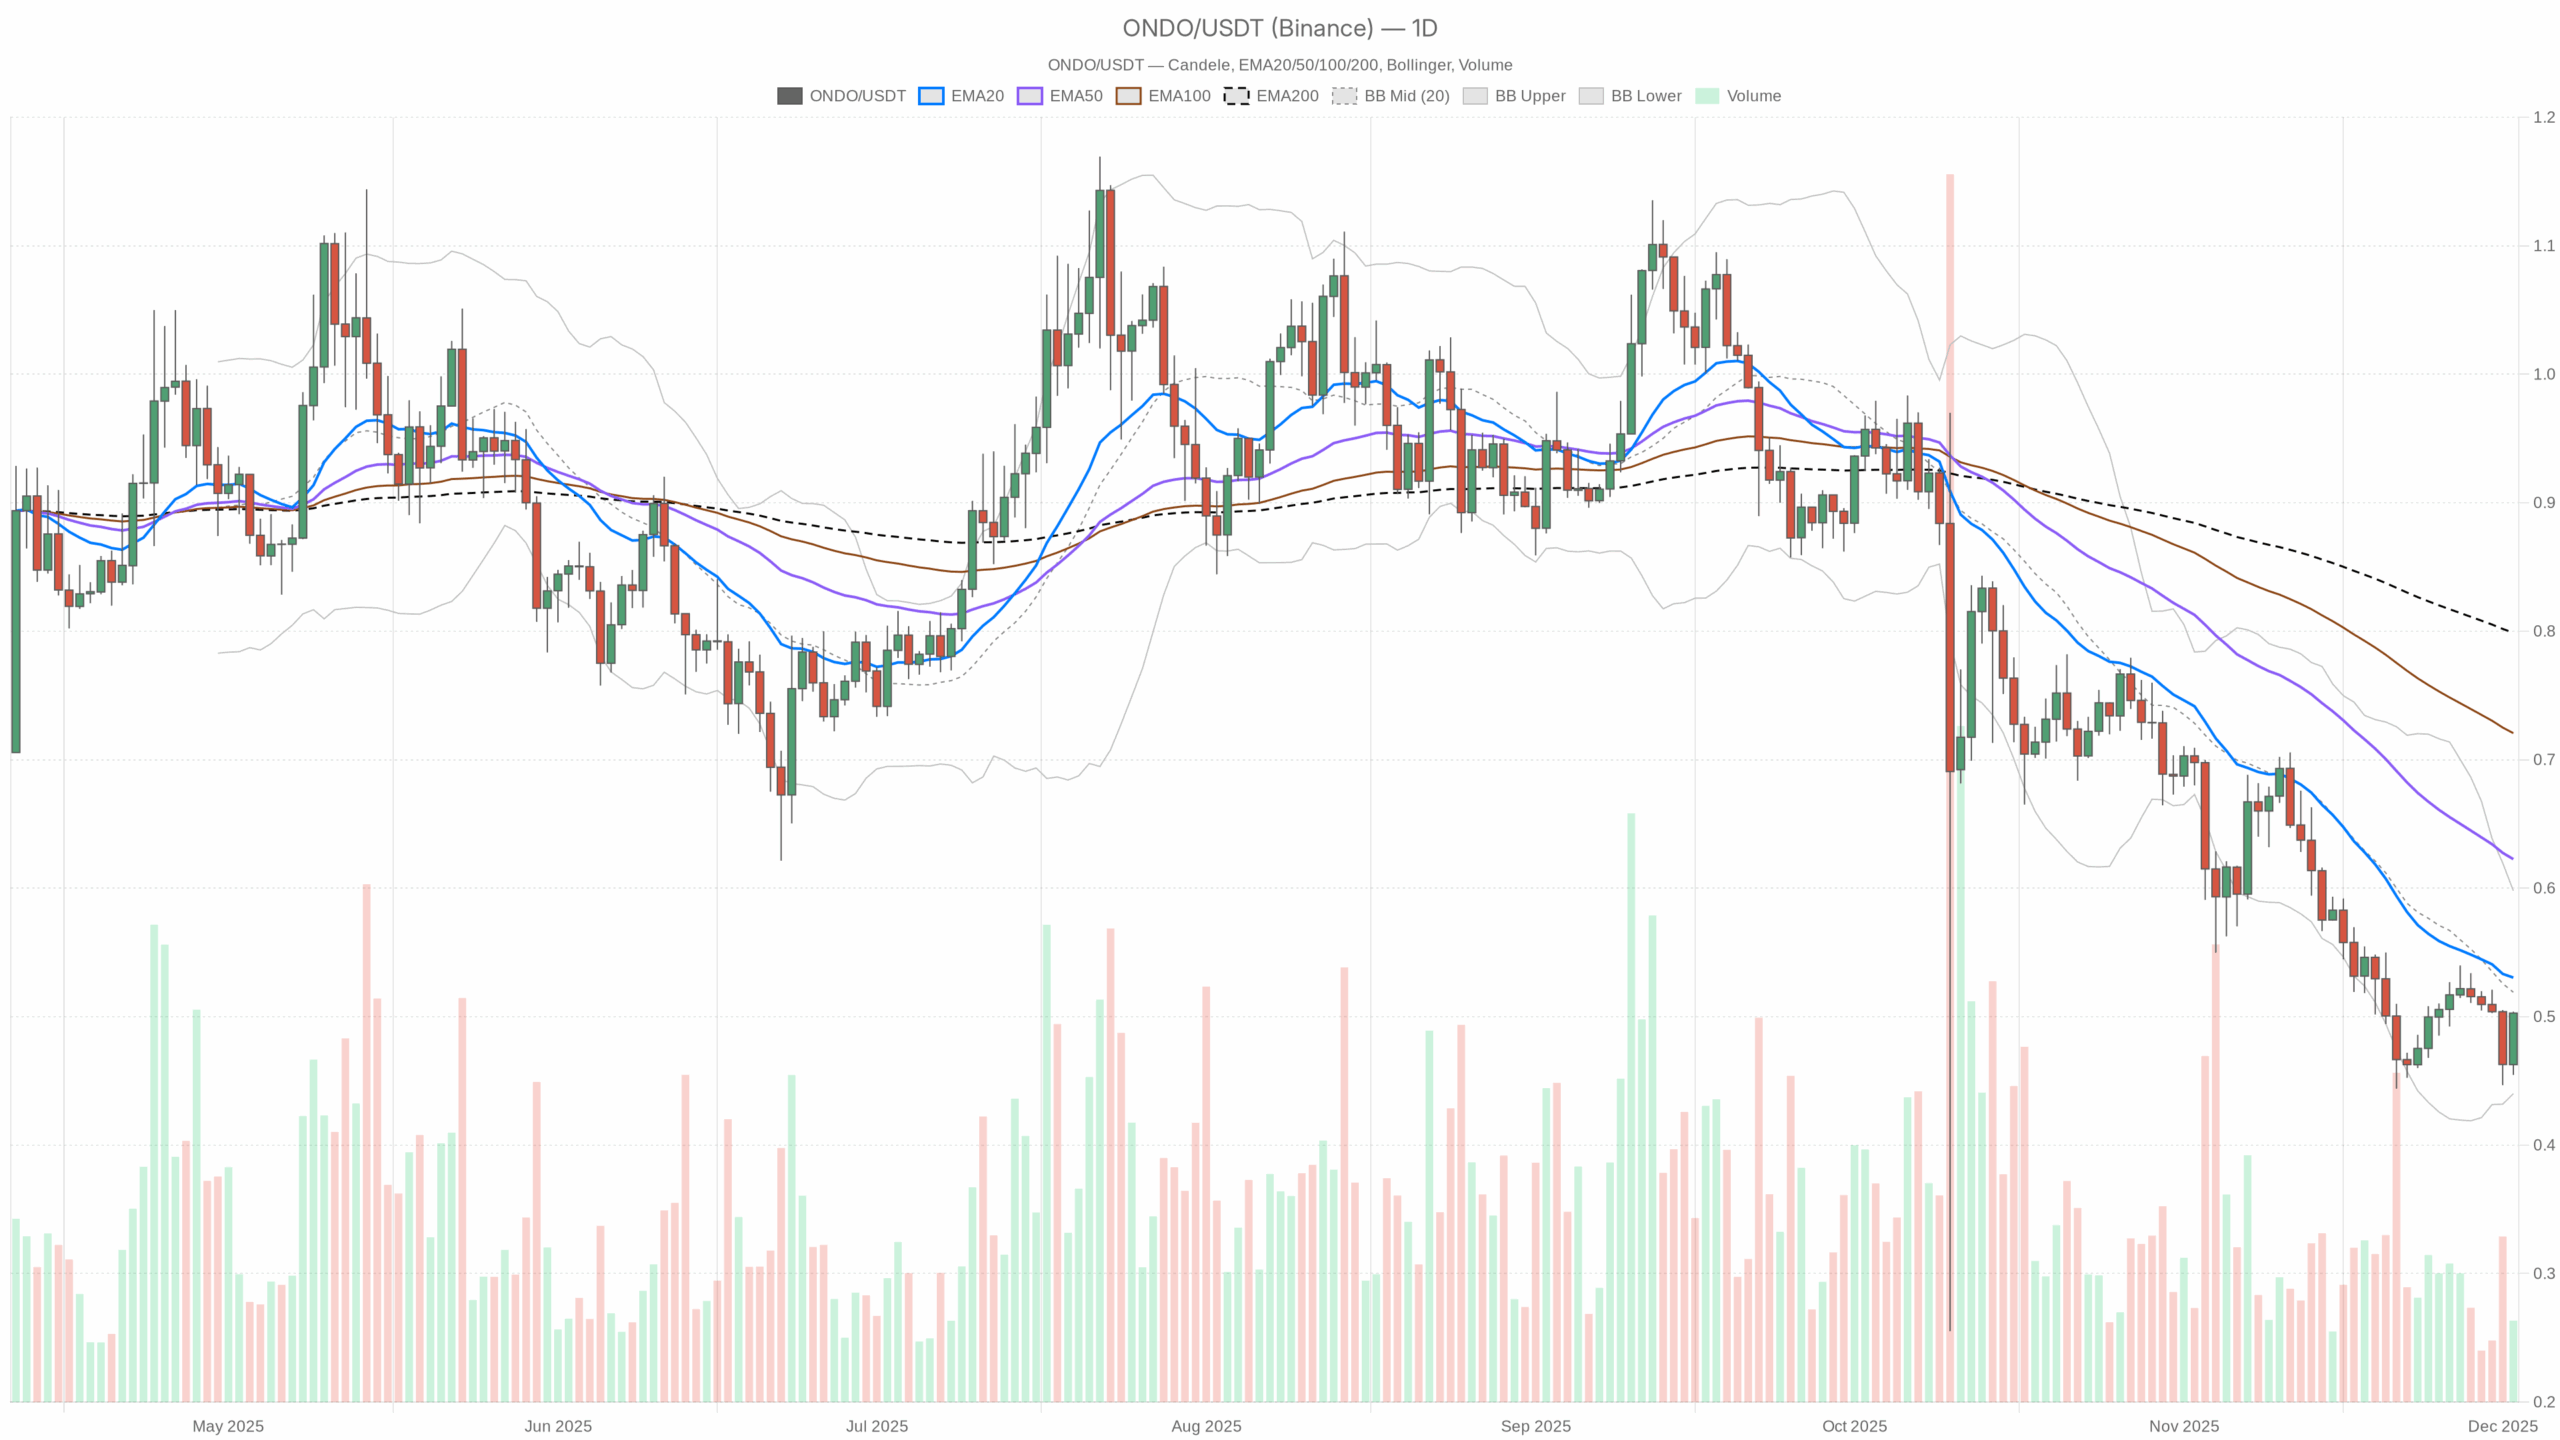 ONDO/USDT — daily chart with candlesticks, EMA20/EMA50 and volume.
Summary
The daily trend remains bearish, with price below all main moving averages and momentum still subdued. The token currently trades around 0.50 USDT, slightly under the 20-day EMA and well below the 50- and 200-day lines, confirming a medium-term downtrend. Daily RSI sits just above oversold territory, hinting at fatigue among sellers but not yet a solid reversal. Meanwhile, volatility is moderate, and ATR on the daily chart suggests controlled but meaningful swings. Intraday timeframes, by contrast, show strong short-term momentum, with elevated RSI and price pushing above local averages. Overall, the setup looks like a market trying to bounce within a larger downside structure.
Ondo crypto: Market Context and Direction
The broader backdrop matters for any altcoin, and right now the global crypto market looks surprisingly resilient. Total capitalization is near $3.15 trillion, with a robust 24-hour increase of about 6.1%, indicating renewed risk appetite across the board. Moreover, Bitcoin dominates with roughly 57.4% market share, which typically channels liquidity toward large caps first, leaving smaller names to play catch-up later.
That said, sentiment data paints a more cautious picture. The Fear & Greed Index is locked in Extreme Fear at 23, suggesting that many market participants are still defensive despite the recent recovery in total value. This divergence between a growing market cap and fearful sentiment often creates conditions for sharp swings as investors overreact to both good and bad news.
In this environment, the token is trying to stabilize after a downtrend. However, with the macro flow still favoring Bitcoin and a few large names, any upside move in smaller assets may need clearer confirmation before it can turn into a sustained advance.
Technical Outlook: reading the overall setup
On the daily chart, the asset closes at 0.50 USDT, below the 20-day EMA at 0.53, the 50-day EMA at 0.62, and the 200-day EMA at 0.80. This alignment, with shorter averages below longer ones, confirms a dominant bearish trend in the medium to long term. It tells us that every rally so far has been sold into and that buyers still have to prove they can reclaim higher ground.
The daily RSI at 40.61 reinforces this reading. It is not oversold, but positioned in a weak momentum zone where sellers still hold the upper hand, though without the aggressive pressure typical of a capitulation. This often precedes either a consolidation phase or a slow grind lower rather than an immediate trend change.
The MACD line sits at -0.04 with its signal at -0.05 and a slightly positive histogram of 0.01. This small positive histogram suggests a mild momentum improvement inside a still negative cycle: downside pressure is easing, but the market has not yet flipped to a confirmed bullish phase.
Bollinger Bands on the daily timeframe show the midline near 0.52, with the upper band at 0.60 and the lower band around 0.44. Price hovers a bit below the middle band, indicating that the recent move is still anchored in the lower half of the volatility envelope. However, the fact that price is not hugging the lower band hints that the downward momentum is losing intensity, opening room for sideways trading or a timid recovery toward the middle of the range.
The daily ATR of 0.04 points to moderate volatility relative to the 0.50 price area. Swings are meaningful but not extreme, which may be appealing for traders seeking defined ranges and risk levels rather than chaotic spikes.
Intraday Perspective and ONDOUSDT token Momentum
On the hourly chart, the picture turns more constructive. Price at 0.50 USDT stands above the 20- and 50-hour EMAs (both at 0.47) and the 200-hour EMA at 0.49. This intraday configuration suggests a short-term bullish bias, as buyers have managed to lift the market above key reference levels despite the broader downtrend.
Meanwhile, the hourly RSI shoots up to 78.13, signaling overbought conditions. Such an extreme reading often emerges during aggressive short-covering rallies or speculative bursts. As a result, while the intraday trend is up, the risk of a pullback or consolidation is elevated in the very near term.
On the 15-minute chart, this tension becomes even clearer. RSI is an extreme 92.79, the 20-, 50-, and 200-period EMAs cluster around 0.47, and price trades at 0.50. This shows a rapid, almost vertical move away from equilibrium, a textbook sign of momentum exhaustion that frequently precedes pauses, sideways chop, or quick mean-reversion dips.
Key Levels and Market Reactions
The daily pivot at 0.49 marks an important balance zone for the current session. Holding above this level suggests that buyers are trying to defend the latest bounce. A sustained move above the first resistance area around 0.52, which coincides with the 20-day EMA and the Bollinger midline, would strengthen the case for a short-term recovery phase within the larger bearish context.
On the downside, the first notable support sits near 0.47. A decisive break back below this area would indicate that the recent intraday strength was only a temporary squeeze, potentially opening the door for a retest of the lower Bollinger region around 0.44. In that scenario, the broader downtrend would be reasserting its dominance, and buyers would need a fresh catalyst to step back in.
If you want to monitor markets with professional charting tools and real-time data, you can open an account on Investing using our partner link:
Open your Investing.com account
This section contains a sponsored affiliate link. We may earn a commission at no additional cost to you.
Future Scenarios and Investment Outlook
Overall, the asset trades as a short-term rebound inside a still fragile broader structure. As long as price remains under the 50- and 200-day EMAs, the main scenario favors a capped recovery rather than a full-fledged trend reversal. Active traders may look for tactical opportunities between the 0.47 support and the 0.52 resistance band, while longer-term participants might wait for clearer signs that the downtrend has been broken, such as a daily close above several key moving averages with confirming momentum signals.
With market sentiment still in Extreme Fear despite a rising global capitalization, any unexpected news could accelerate moves in either direction. For now, caution, disciplined risk management, and respect for the prevailing daily downtrend remain crucial for anyone engaging with this volatile cryptocurrency.
This analysis is for informational purposes only and does not constitute financial advice.
Readers should conduct their own research before making investment decisions.
Potrebbe anche piacerti

Bitcoin ETFs Outpace Ethereum With $2.9B Weekly Surge

Michael Saylor Pushes Digital Capital Narrative At Bitcoin Treasuries Unconference