Avalanche (AVAX) Price Prediction 2026, 2027-2030
- Bullish AVAX price prediction for 2026 is $18.76 to $26.92.
- Avalanche (AVAX) price might reach $50 soon.
- Bearish AVAX price prediction for 2026 is $8.56.
In this Avalanche (AVAX) price prediction 2026, 2027-2030, we will analyze the price patterns of AVAX by using accurate trader-friendly technical analysis indicators and predict the future movement of the cryptocurrency.
|
TABLE OF CONTENTS
|
|
INTRODUCTION
|
|
|
AVALANCHE (AVAX) PRICE PREDICTION 2026
|
|
| AVALANCHE (AVAX) PRICE PREDICTION 2027, 2028-2030 |
| CONCLUSION |
| FAQ |
Avalanche (AVAX) Current Market Status
| Current Price | $14.25 |
| 24 – Hour Price Change | 3.11% Down |
| 24 – Hour Trading Volume | $471.66M |
| Market Cap | $6.14B |
| Circulating Supply | 422.27M AVAX |
| All – Time High | $146.22 (Nov 21, 2021) |
| All – Time Low | $2.79 (On Dec 31, 2020) |
What is Avalanche (AVAX)
| TICKER | AVAX |
| BLOCKCHAIN | Avalanche |
| CATEGORY | Web3 |
| LAUNCHED ON | September 2020 |
| UTILITIES | Governance, security, gas fees & rewards |
Avalanche (AVAX) is the native cryptocurrency of the Avalanche network. AVAX was launched in 2020. Avalanche is an open-source decentralized blockchain for creating dApps and customized blockchains. It is popularly known as the “winter-themed” ecosystem that holds AVAX, the “red coin.”
AVAX tokens have 3 primary use cases. Firstly, they serve as the transaction fee. They serve as the fundamental unit for all Avalanche’s subnets. Moreover, users can stake AVAX and earn these tokens as rewards.
Avalanche comprises 3 interoperable blockchains with distinct functionalities and multiple subnets. The Exchange Chain (X-Chain) handles the trading activities. The contract chain (C-Chain) meant for creating dApps. The Platform Chain (P-Chain), meant for validating transactions and maintaining subnets.
Moreover, recently, Grayscale unveiled an Avalanche Investment Trust in August. The firm intends to use the trust to enable investors the option of direct investing in AVAX.
Avalanche 24H Technicals
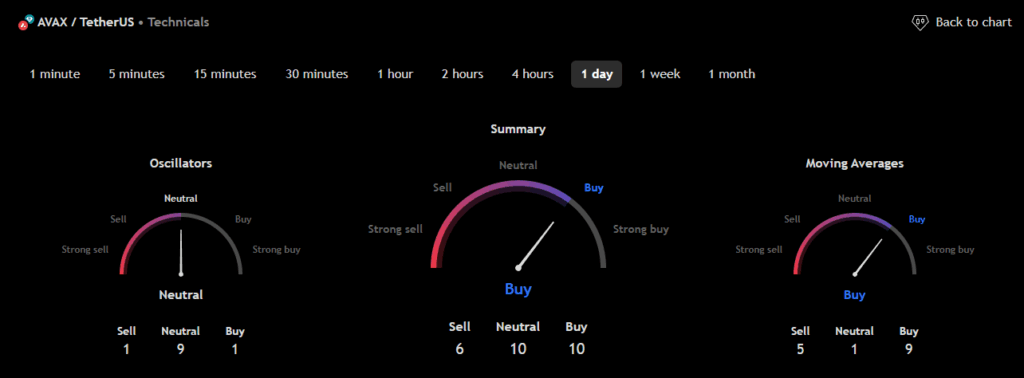 (Source: TradingView)
Avalanche (AVAX) Price Prediction 2026
Avalanche (AVAX) ranks 20th on CoinMarketCap in terms of its market capitalization. The overview of the Avalanche price prediction for 2026 is explained below with a daily time frame.
In the above chart, Avalanche (AVAX) laid out a cup and handle pattern. A Cup and handle price pattern on a security’s price chart is a technical indicator that resembles a cup with a handle, where the cup is in the shape of a “u” and the handle has a slight downward drift. The cup and handle are considered a bullish signal, with the right-hand side of the pattern typically experiencing lower trading volume. A Cup and handle is considered a bullish signal extending an uptrend, and it is used to spot opportunities to go long. A cup and handle is a technical indicator where the security price movement resembles a cup followed by a downward-trending price pattern. This drop or handle signals a buying opportunity to go long on the security.
At the time of analysis, the price of Avalanche (AVAX) was recorded at $14.25. If the pattern trend continues, then the price of AVAX might reach the resistance levels of $15.08 and $19.76. If the trend reverses, then the price of AVAX may fall to the support levels of $13.54 and $11.28.
Avalanche (AVAX) Resistance and Support Levels
The chart given below elucidates the possible resistance and support levels of Avalanche (AVAX) in 2026.
From the above chart, we can analyze and identify the following as the resistance and support levels of Avalanche (AVAX) for 2026.
| Resistance Level 1 | $18.76 |
| Resistance Level 2 | $26.92 |
| Support Level 1 | $12.63 |
| Support Level 2 | $8.56 |
AVAX Resistance & Support Levels
Avalanche (AVAX) Price Prediction 2026 — RVOL, MA, and RSI
The technical analysis indicators such as Relative Volume (RVOL), Moving Average (MA), and Relative Strength Index (RSI) of Avalanche (AVAX) are shown in the chart below.
From the readings on the chart above, we can make the following inferences regarding the current Avalanche (AVAX) market in 2026.
| INDICATOR | PURPOSE | READING | INFERENCE |
| 50-Day Moving Average (50MA) | Nature of the current trend by comparing the average price over 50 days | 50 MA = $13.45Price = $14.26 (50MA < Price) |
Bullish/Up1trend |
| Relative Strength Index (RSI) | Magnitude of price change;Analyzing oversold & overbought conditions | 56.69 <30 = Oversold 50-70 = Neutral>70 = Overbought |
Neutral |
| Relative Volume (RVOL) | Asset’s trading volume in relation to its recent average volumes | Below cutoff line | Weak Volume |
Avalanche (AVAX) Price Prediction 2026 — ADX, RVI
In the below chart, we analyze the strength and volatility of Avalanche (AVAX) using the following technical analysis indicators — Average Directional Index (ADX) and Relative Volatility Index (RVI).
From the readings on the chart above, we can make the following inferences regarding the price momentum of Avalanche (AVAX).
| INDICATOR | PURPOSE | READING | INFERENCE |
| Average Directional Index (ADX) | Strength of the trend momentum | 24.75 | Weak Trend |
| Relative Volatility Index (RVI) | Volatility over a specific period | 35.25 <50 = Low >50 = High |
Low Volatility |
Comparison of AVAX with BTC, ETH
Let us now compare the price movements of Avalanche (AVAX) with that of Bitcoin (BTC), and Ethereum (ETH).
From the above chart, we can interpret that the price action of AVAX is similar to that of BTC and ETH. That is, when the price of BTC and ETH increases or decreases, the price of AVAX also increases or decreases, respectively.
Avalanche (AVAX) Price Prediction 2027, 2028 – 2030
With the help of the aforementioned technical analysis indicators and trend patterns, let us predict the price of Avalanche (AVAX) between 2027, 2028, 2029, and 2030.
| Year | Bullish Price | Bearish Price |
| Avalanche (AVAX) Price Prediction 2027 | $65 | $8 |
| Avalanche (AVAX) Price Prediction 2028 | $75 | $7 |
| Avalanche (AVAX) Price Prediction 2029 | $85 | $6 |
| Avalanche (AVAX) Price Prediction 2030 | $95 | $5 |
Conclusion
If Avalanche (AVAX) establishes itself as a good investment in 2026, this year would be favorable to the cryptocurrency. In conclusion, the bullish Avalanche (AVAX) price prediction for 2026 is $26.92. Comparatively, the bearish Avalanche (AVAX) price prediction for 2026 is $8.56.
If there is a positive elevation in the market momentum and investors’ sentiment, then Avalanche (AVAX) might hit $50. Furthermore, with future upgrades and advancements in the Avalanche ecosystem, AVAX might surpass its current all-time high (ATH) of $146.22 and mark its new ATH.
FAQ
1. What is Avalanche (AVAX)?
Avalanche (AVAX) is the native cryptocurrency of the Avalanche network. AVAX was launched in 2020. Avalanche is an open-source decentralized blockchain for creating dApps and customized blockchains.
2. Where can you buy Avalanche (AVAX)?
Avalanche (AVAX) has been listed on many crypto exchanges which include Binance, OKX, Bybit, DigiFinex, and CoinTR Pro.
3. Will Avalanche (AVAX) record a new ATH soon?
With the ongoing developments and upgrades within the Avalanche platform, Avalanche (AVAX) has a high possibility of reaching its ATH soon.
4. What is the current all-time high (ATH) of Avalanche (AVAX)?
Avalanche (AVAX) hit its current all-time high (ATH) of $146.22 on Nov 21, 2021.
5. What is the lowest price of Avalanche (AVAX)?
According to CoinMarketCap, AVAX hit its all-time low (ATL) of $2.79 on Dec 31, 2020.
6. Will Avalanche (AVAX) hit $50?
If Avalanche (AVAX) becomes one of the active cryptocurrencies that maintains a bullish trend, it might rally to hit $50 soon.
7. What will be the Avalanche (AVAX) price by 2027?
Avalanche (AVAX) price might reach $65 by 2027.
8. What will be the Avalanche (AVAX) price by 2028?
Avalanche (AVAX) price might reach $75 by 2028.
9. What will be the Avalanche (AVAX) price by 2029?
Avalanche (AVAX) price might reach $85 by 2029.
10. What will be the Avalanche (AVAX) price by 2030?
Avalanche (AVAX) price might reach $95 by 2030.
Top Crypto Predictions
Cosmos (ATOM) Price Prediction
Ondo (ONDO) Price Prediction
Flare (FLR) Price Prediction
Disclaimer: The opinion expressed in this article is solely the author’s. It does not represent any investment advice. TheNewsCrypto team encourages all to do their own research before investing.
Potrebbe anche piacerti

EUR/CHF slides as Euro struggles post-inflation data

Interview | HIVE CFO: Hydro-cooled mining and AI cloud give us an edge post-halving