

Bitcoin crypto news and BTCUSDT: sentiment, fear and key levels
 In today’s landscape, Bitcoin crypto news is dominated by a market that looks tired after an extended euphoric run. The spot pair against Tether now trades near 91,200, and the chart suggests a market that is trying to stabilize after a sharp slide rather than launching straight into a new trend. However, under the surface there is a complex mix of fear, structural dominance, and conflicting signals across timeframes that traders must unpack carefully.
 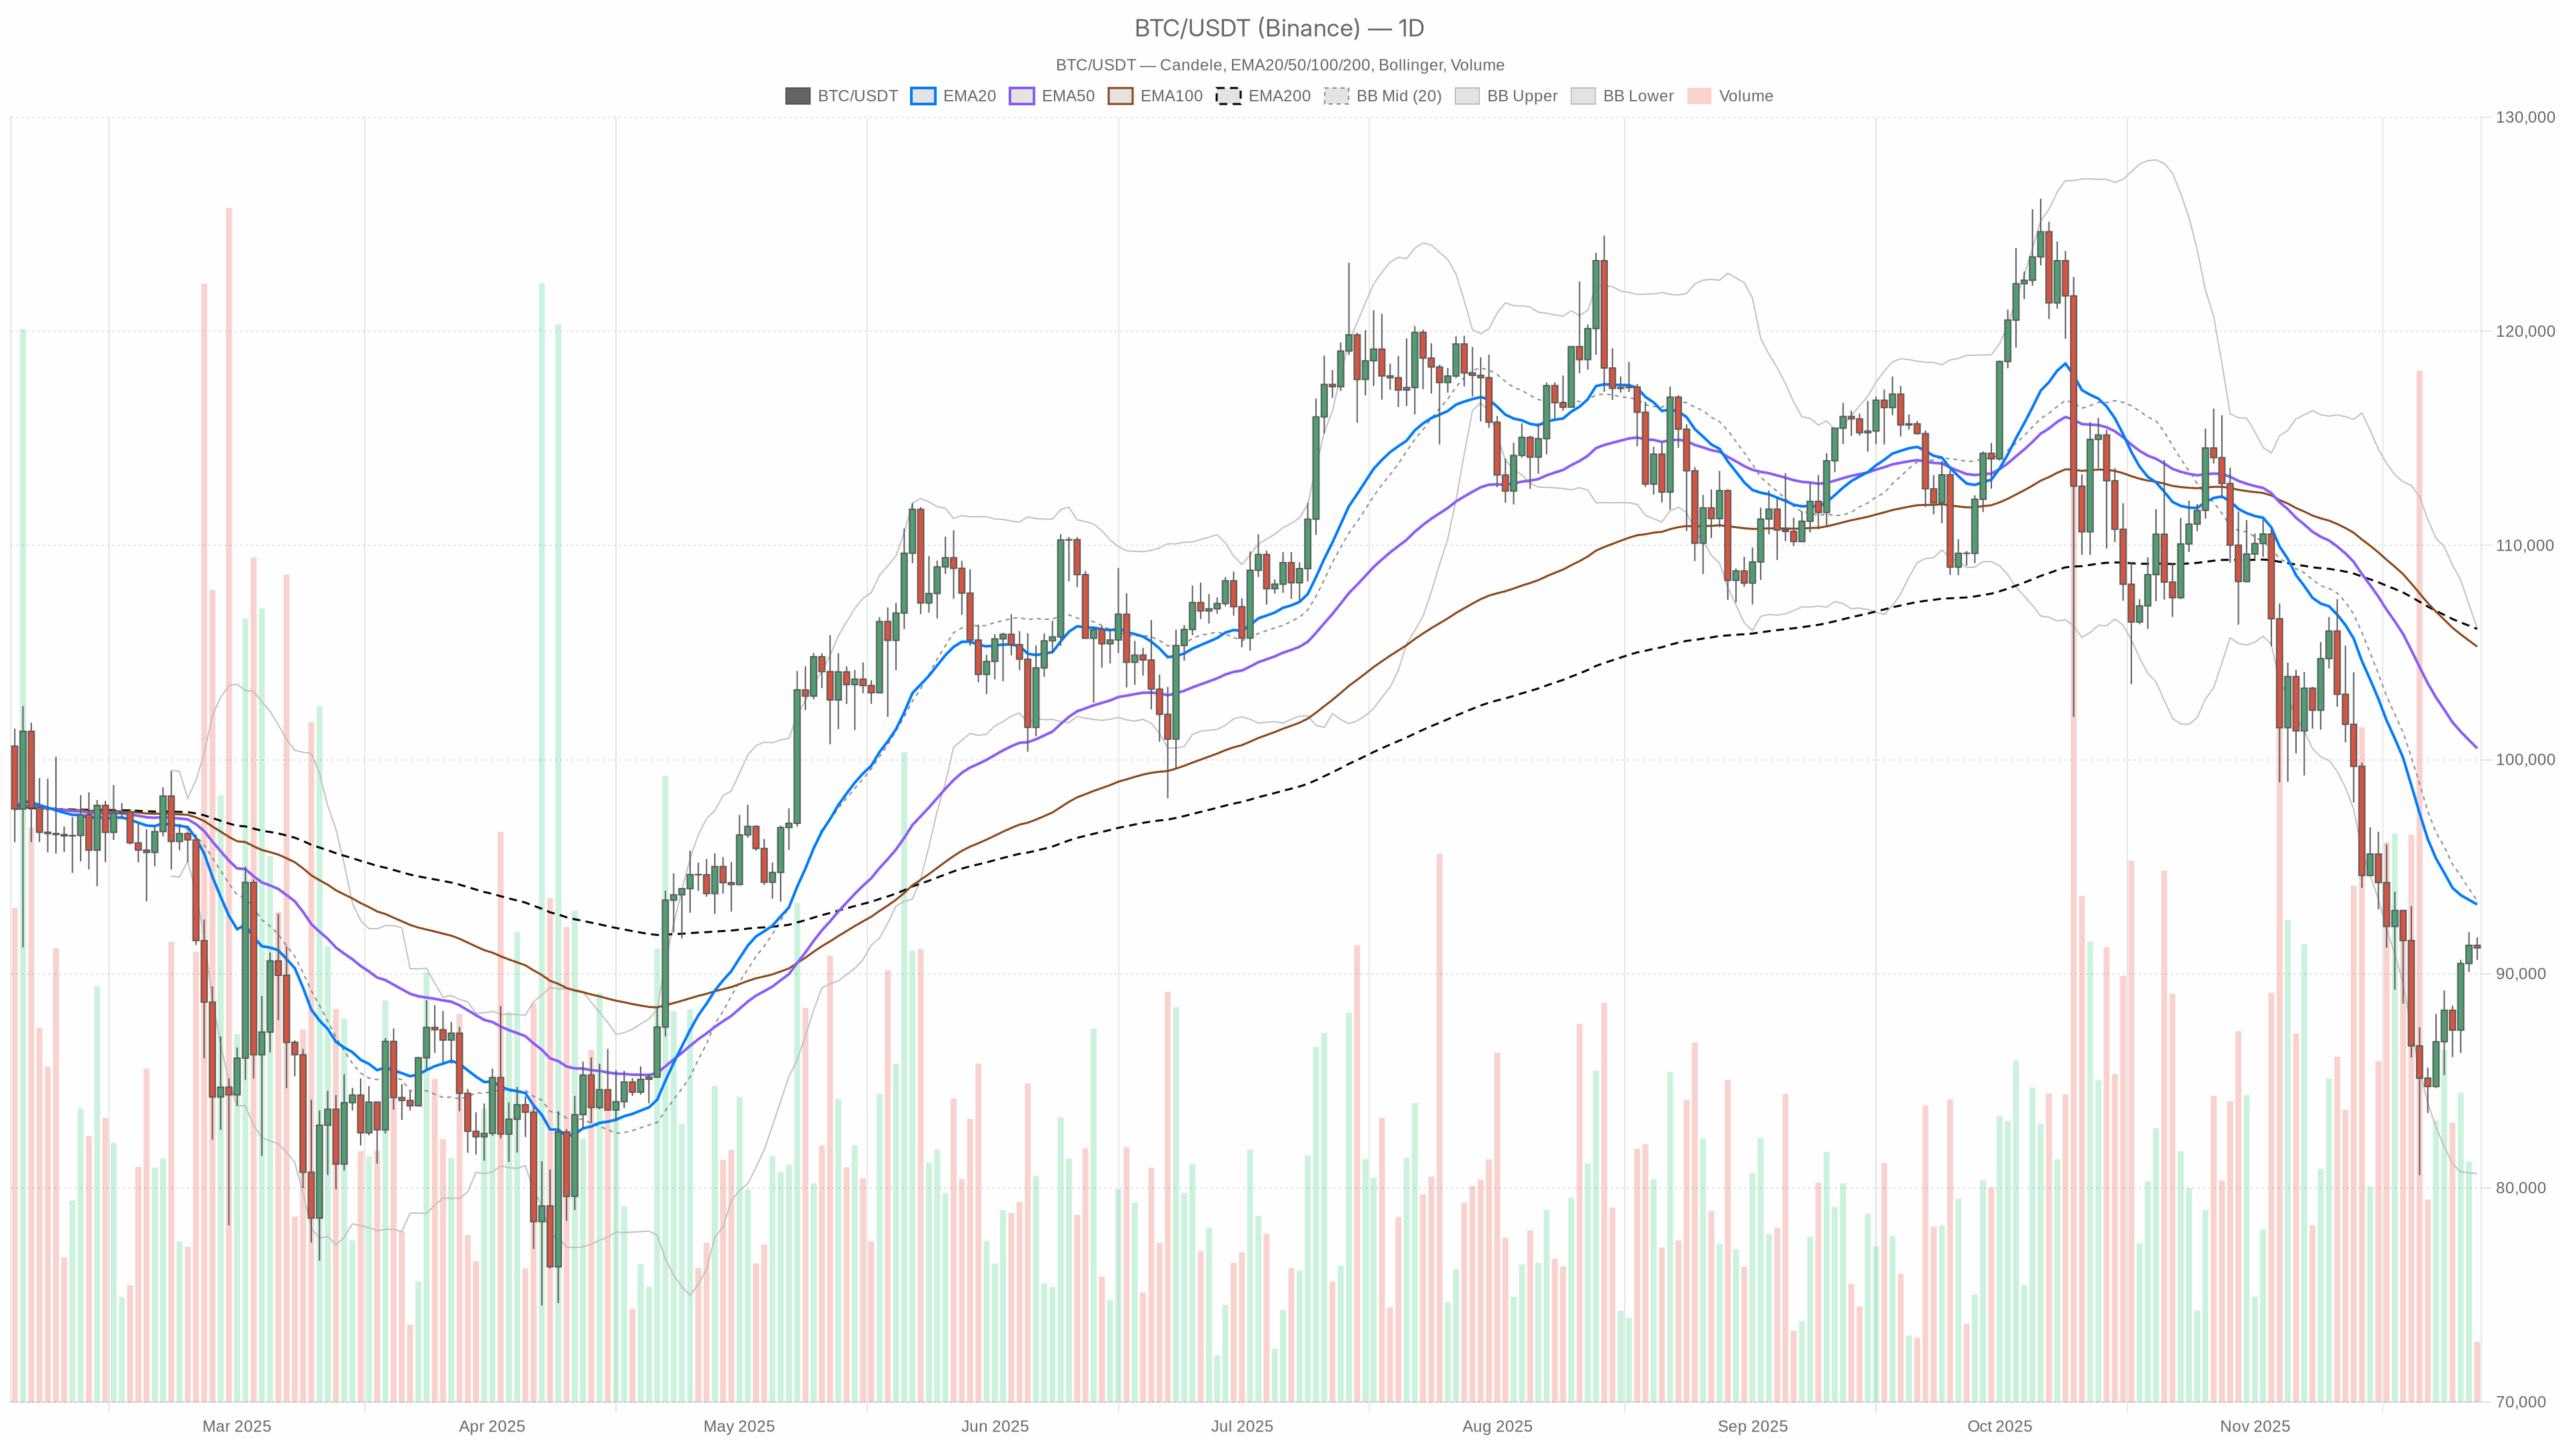 BTC/USDT — daily chart with candlesticks, EMA20/EMA50 and volume.
Summary
The daily setup for BTC is clearly tilted to the downside, with price below all major moving averages and the regime flagged as bearish. Momentum on the higher timeframe is weak, although not yet in capitulation territory. Moreover, intraday charts show pockets of strength, with the hourly trend still labeled bullish, hinting at active dip-buying attempts. Volatility remains elevated but controlled, with the daily Average True Range near 3,800 points, making position sizing crucial. Market-wide, total capitalization sits just above 3.19 trillion dollars after a mild 24hr pullback. Meanwhile, the sentiment gauge in the form of the Fear & Greed Index has dropped to Extreme Fear, suggesting that many participants are already positioned defensively.
Bitcoin crypto news: Market Context and Direction
The broader crypto environment is consolidating after an overheated phase, with the total market cap around 3.19 trillion dollars and a small daily decline of about 0.3%. That said, Bitcoin‘s share of that pie remains dominant at roughly 57% of total capitalization, a sign that investors are still sheltering in the largest and most liquid asset rather than rotating aggressively into altcoins. Moreover, this robust dominance often accompanies periods of stress, when traders reduce risk and retreat from speculative corners of the market.
The Fear & Greed Index at 25, squarely in Extreme Fear, confirms that mood. Many portfolios have already been derisked, and forced sellers might be exhausted or close to it. In contrast, such conditions can also delay strong upside follow through because sidelined capital tends to reenter gradually. Against this backdrop, the main scenario on the daily chart remains a downtrend continuation, but with growing potential for sharp countertrend rallies whenever headlines or liquidity shocks surprise consensus.
Technical Outlook: reading the overall setup
On the daily timeframe, the spot price around 91,214 sits below the 20day exponential moving average at about 93,242, the 50day near 100,536 and the 200day around 106,111. This stacked configuration of EMAs, all above the current price, reflects a well established bearish phase, where rallies are, for now, more likely to be sold into than extended. For medium term investors, it signals that the burden of proof lies with the bulls.
The 14day RSI at roughly 41 is below the midline yet far from oversold. This indicates waning momentum rather than panic: sellers are in control, but they are no longer as aggressive as during the steepest parts of the decline. As a result, the market has room to move in either direction without immediately triggering classical oversold signals.
Looking at MACD, the main line sits around -4,355 with the signal line near -4,941, and the histogram is slightly positive. This subtle positive histogram hints at an early momentum stabilization phase inside a still negative trend. Bears remain structurally ahead, but their grip is loosening, which often precedes either a sideways consolidation or a counter-trend bounce.
Bollinger Bands on the daily chart show a midline close to 93,418, with the upper band near 106,165 and the lower band around 80,671. Price currently hovers just under the middle band, following recent trading near the lower boundary. This suggests that the previous volatility expansion to the downside is cooling, and the asset is attempting to re0center within its recent range rather than extend the selloff immediately.
The daily ATR near 3,776 confirms that swings remain wide in absolute terms. For active traders, this level of elevated volatility demands disciplined risk management, because even intraday fluctuations can translate into multi-thousand dollar moves per coin.
Intraday Perspective and BTCUSDT token Momentum
On the hourly chart, the picture brightens. Price is trading marginally above the 20 and 50 period EMAs, which sit around 91,161 and 90,377 respectively, and also above the 200 period near 89,177. Meanwhile, the intraday regime flag is bullish, indicating that short-term flows have turned in favor of buyers. This typically reflects short covering and opportunistic positioning rather than a fully fledged reversal.
The hourly RSI at about 53 supports this view: it is slightly above neutral, signaling moderate upside momentum but not exuberance. However, the hourly MACD line remains just below its signal, with a mildly negative histogram, revealing that this bounce is still fragile and could stall if no fresh catalysts appear.
On 15minute charts, the market looks more indecisive. The close sits almost exactly on top of the short EMAs around 91,256, with the regime flagged as neutral and RSI near 48. This suggests a short-term equilibrium between buyers and sellers, where scalpers are fading both sides rather than committing strongly in one direction. As a result, intraday structure is supportive but not yet strong enough to override the bearish daily backdrop.
Key Levels and Market Reactions
Daily pivot levels cluster tightly around current prices. The main pivot point stands near 91,192, almost exactly at the market, underscoring this as a battleground area. A first band of resistance emerges around 91,731 on the daily and 91,357 on the hourly chart; if price can close convincingly above this region, it would reinforce the case for a short-term breakout attempt toward the 20day EMA in the low 93,000s.
On the downside, immediate support lies around 90,675 on the daily and just below 91,000 on shorter timeframes. A clean break under this pocket would signal that bears are regaining the upper hand, opening the door to a potential trend continuation toward the lower Bollinger Band zone around the high 80,000s to low 80,000s. Traders will be watching how price reacts intraday around these bands, since strong wicks and quick reclaims would favor the view that downside pressure is slowly exhausting.
Future Scenarios and Investment Outlook
Overall, the main scenario remains cautious: the daily chart points to an ongoing bearish regime, while intraday strength looks more like repair than renewal. If the asset manages to reclaim the 20day EMA and hold above it, the market could transition into a broader consolidation phase, giving long-term investors time to accumulate gradually. In contrast, failure to defend nearby supports might extend the correction, especially if macro headlines or fresh Bitcoin crypto news inject additional fear into an already nervous environment.
For investors and traders alike, the mix of high volatility, dominant market share, and extreme fear suggests that patience and flexibility are key. Staggered entries, tight position sizing, and respect for the highlighted levels can help navigate a market that is no longer euphoric but not yet comfortably cheap.
This analysis is for informational purposes only and does not constitute financial advice.
Readers should conduct their own research before making investment decisions.
Potrebbe anche piacerti

VGTEL in Strategic Talks to Acquire Consciousness-Focused Health-Tech Platform

Top 10 free crypto cloud mining platforms in 2026

