

Interpretation of six major indicators: What will the price of Bitcoin be by the end of this year?
By: ElonMoney Research
Compiled by: Felix, PANews
This analysis uses indicators such as MVRV Z-Score, Energy Value Oscillator, Bitcoin Heater, and historical data. Although historical data is a useful reference, it may be less accurate in the current environment because there are no participants such as Strategy, Metaplanet, and ETFs in the 2021 cycle.
MVRV Z-Score
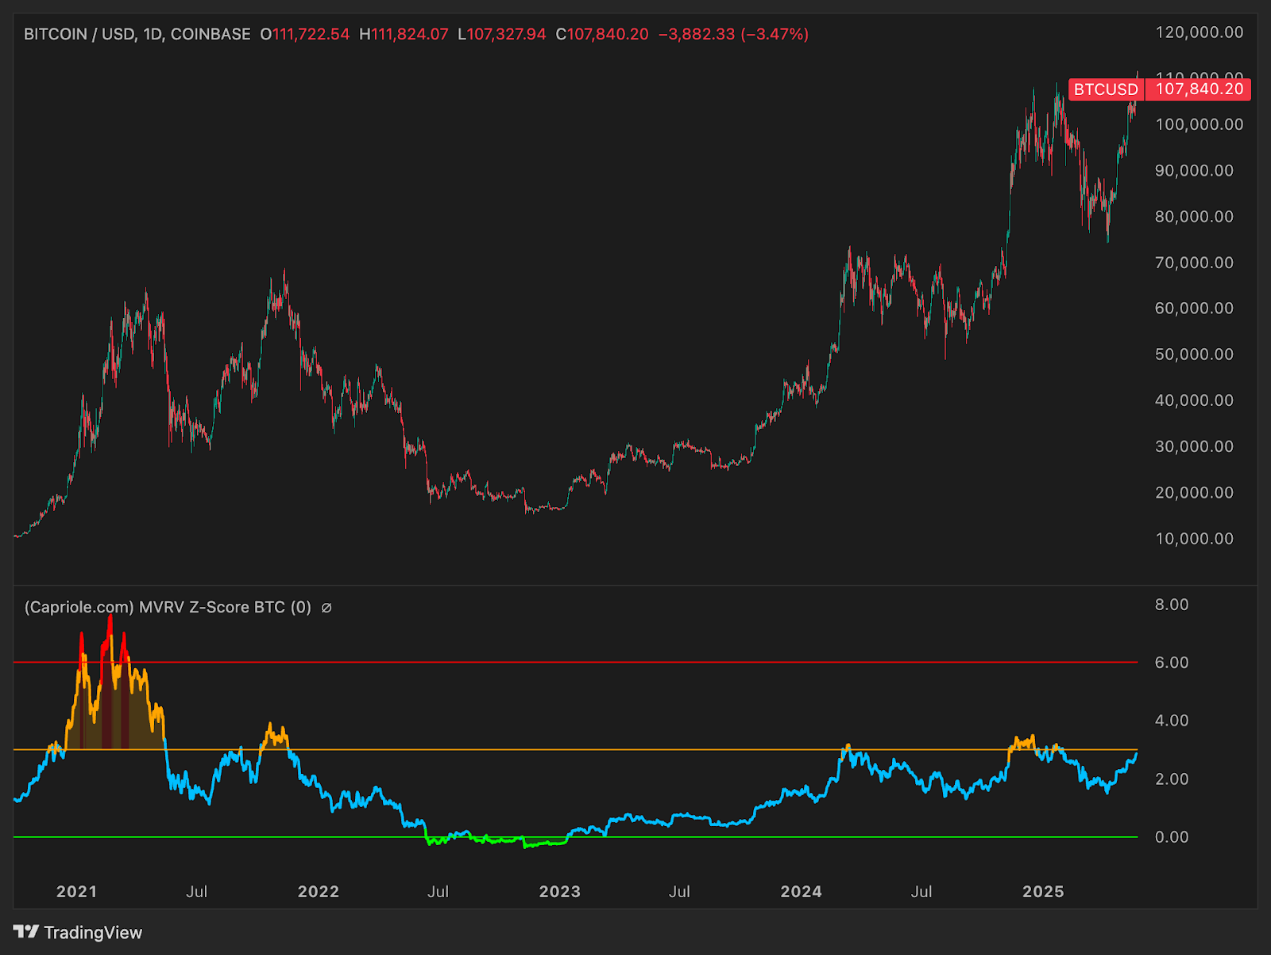
The MVRV Z-Score indicator is a measure of market valuation that finds the tops and bottoms of market cycles by comparing the degree of deviation from fair value when an asset is undervalued or overvalued. The chart shows that the current MVRV Z-Score is about 2 to 3, which is in the neutral zone and far away from the overheated values that appear at the top of the market. Historically, the peak of the Bitcoin cycle will push the indicator into the red zone (about 7 to 9), indicating a huge disconnect between market value and realized value. Today, the indicator is slightly above 2 and in the blue/yellow zone, indicating that Bitcoin is not overvalued.
For context: In early 2021, this indicator was above 7 before Bitcoin reached around $60,000-$65,000. During the 2022 bear market, the indicator fell below 0 (green area), indicating that the market was oversold.
From a technical perspective, there is still a lot of room to rise from current levels before this cycle ends. Even if Bitcoin reaches about $100,000-110,000, it is not "expensive" according to MVRV standards. If Bitcoin repeats the structural pattern of previous tops, the MVRV Z-Score indicator is expected to rise to 5 to 7 or higher.
This means that there is significant upside ahead for the market. Basic extrapolation suggests that tops based on MVRV tend to occur when BTC is trading well above $100,000 — possibly above $200,000, depending on how realized market cap changes over the next few months.
Energy Value Oscillator
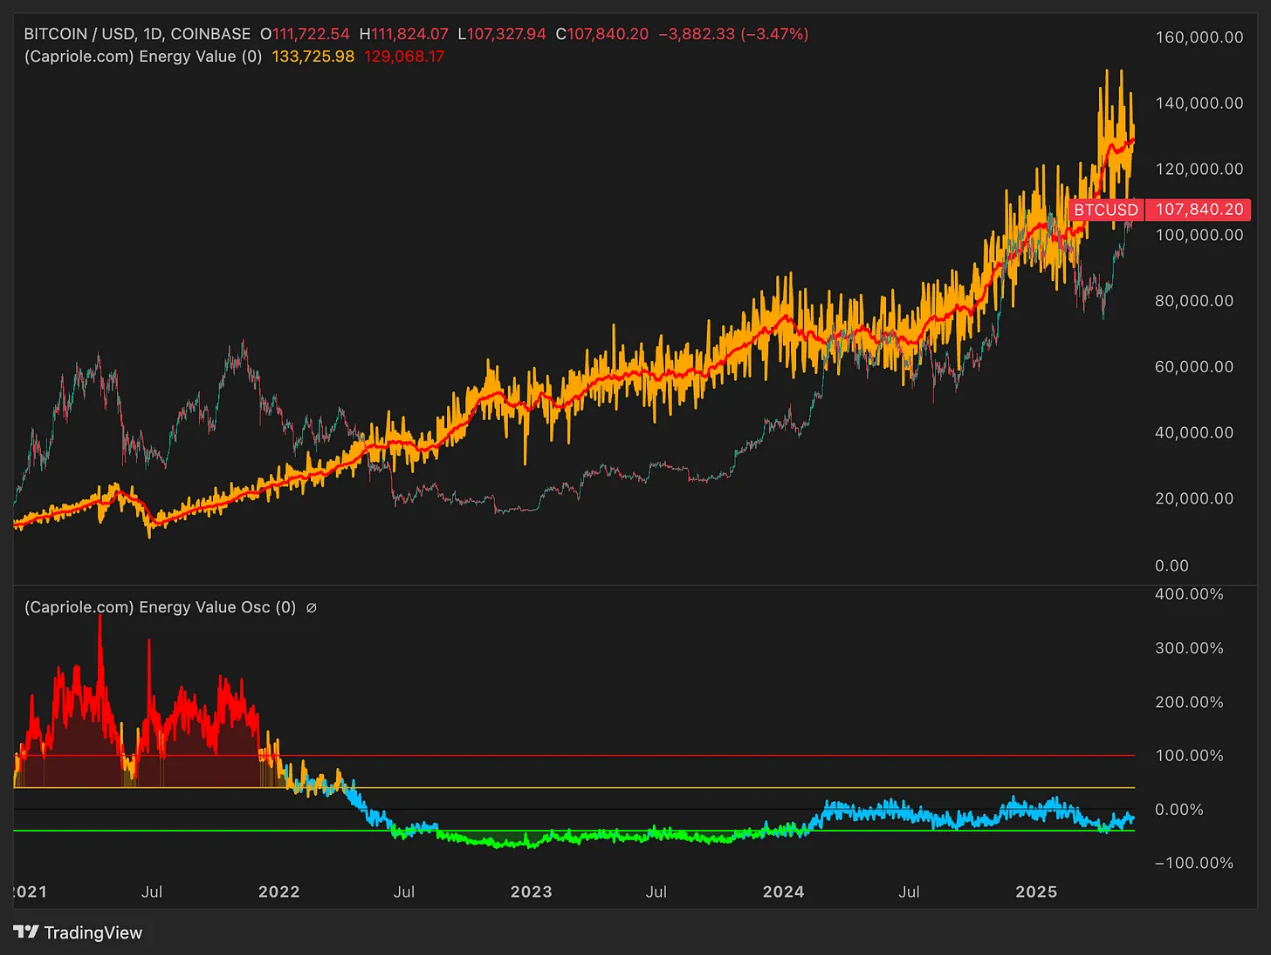
The indicator measures the "fair value" of Bitcoin based on total energy (energy value = hash rate × energy efficiency). The red and orange line in the above chart marks the fair value based on energy - about $130,000 as of mid-2025. The blue oscillator below tracks the deviation of the current price from this benchmark.
Historically, when Bitcoin is trading well above its energy value, the oscillator enters the red zone (over 100% valuation). In early 2021, Bitcoin was trading at around $60,000, when its price was over 100% above its energy value. Conversely, in 2022, Bitcoin is trading below its energy value and the oscillator is in the green (undervalued) zone.
Currently, the oscillator is near zero and Bitcoin ($107,000-110,000) is trading 10%-20% below the fair value calculated by the model. This suggests that Bitcoin is not overheated. If the energy value reaches about $150,000 by the second half of 2025 and the price trades at a 50%-100% premium (more common near cycle peaks), this would imply a price range of $225,000-300,000.
In other words: The Energy Value Oscillator confirms that Bitcoin still has plenty of room to run. Until the oscillator breaks above +100%, it is unlikely that the market will be in a state of “extreme overvaluation” by this standard.
Bitcoin Heater (derivatives overheat indicator)
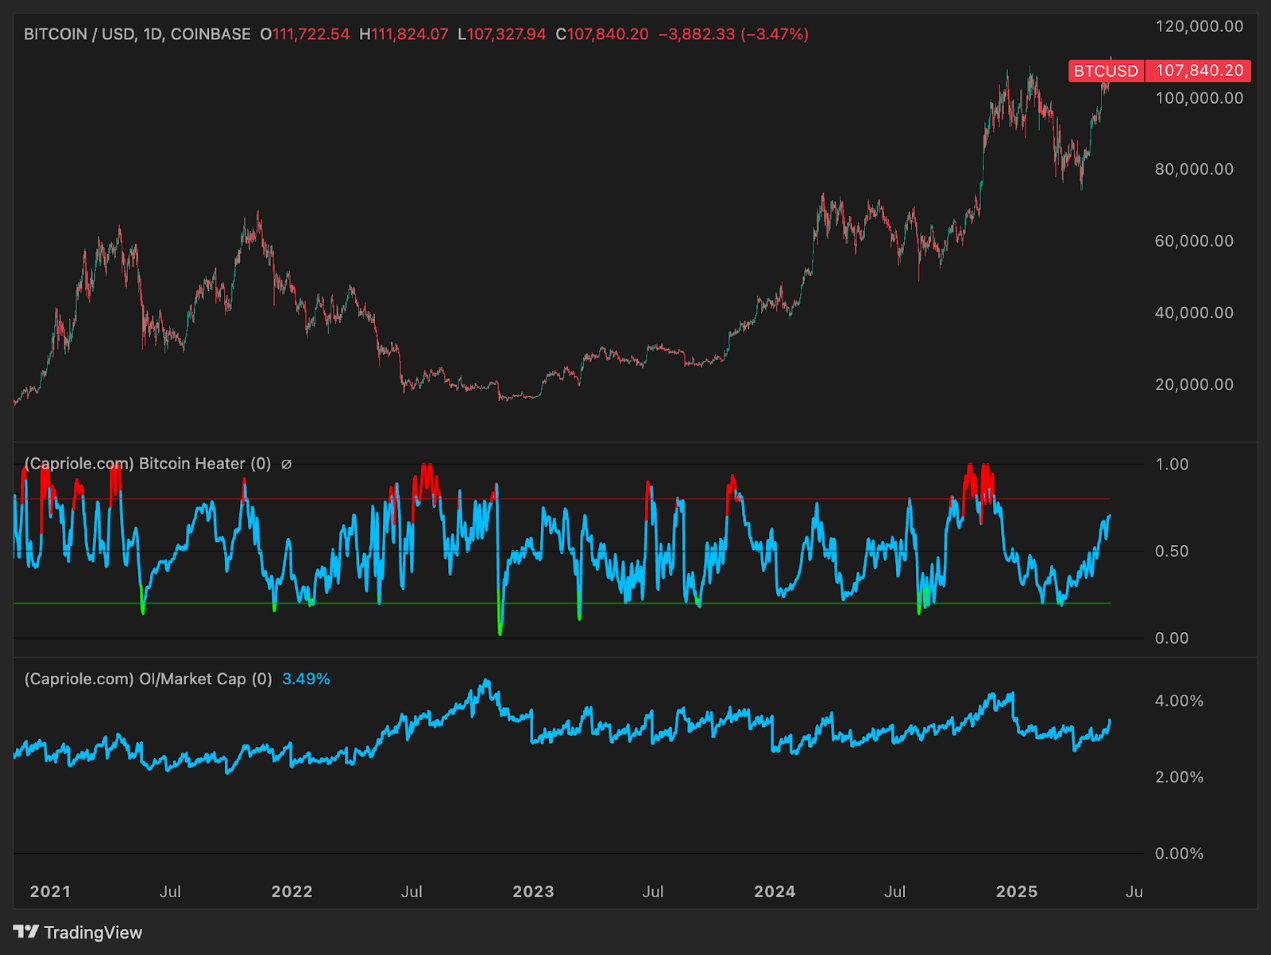
The Bitcoin Heater indicator aggregates derivatives sentiment (funding rates, basis, option skew) into a single index between 0 and 1. An indicator close to 1.0 indicates bubbles, aggressive long positions, and high leverage. An indicator around 0.0 to 0.3 indicates a cooling market or risk aversion.
In previous cycles (especially in 2021), the indicator often broke through 0.8 before local corrections. But during the strong bull market (Q4 2020 to Q1 2021), the indicator remained high but did not immediately trigger a reversal. As of mid-2025, the indicator is around 0.6 to 0.7, which is warm but not overheated.
This suggests that we have not yet entered the end of the cycle. In the final upswing, the indicator may reach 0.8 to 1.0. Until then, the market still has room to rise. It is reasonable for the indicator to exceed 0.8 periodically before reaching a top, but the final peak is likely to coincide with a persistent red zone indicator.
Macro Index Oscillator
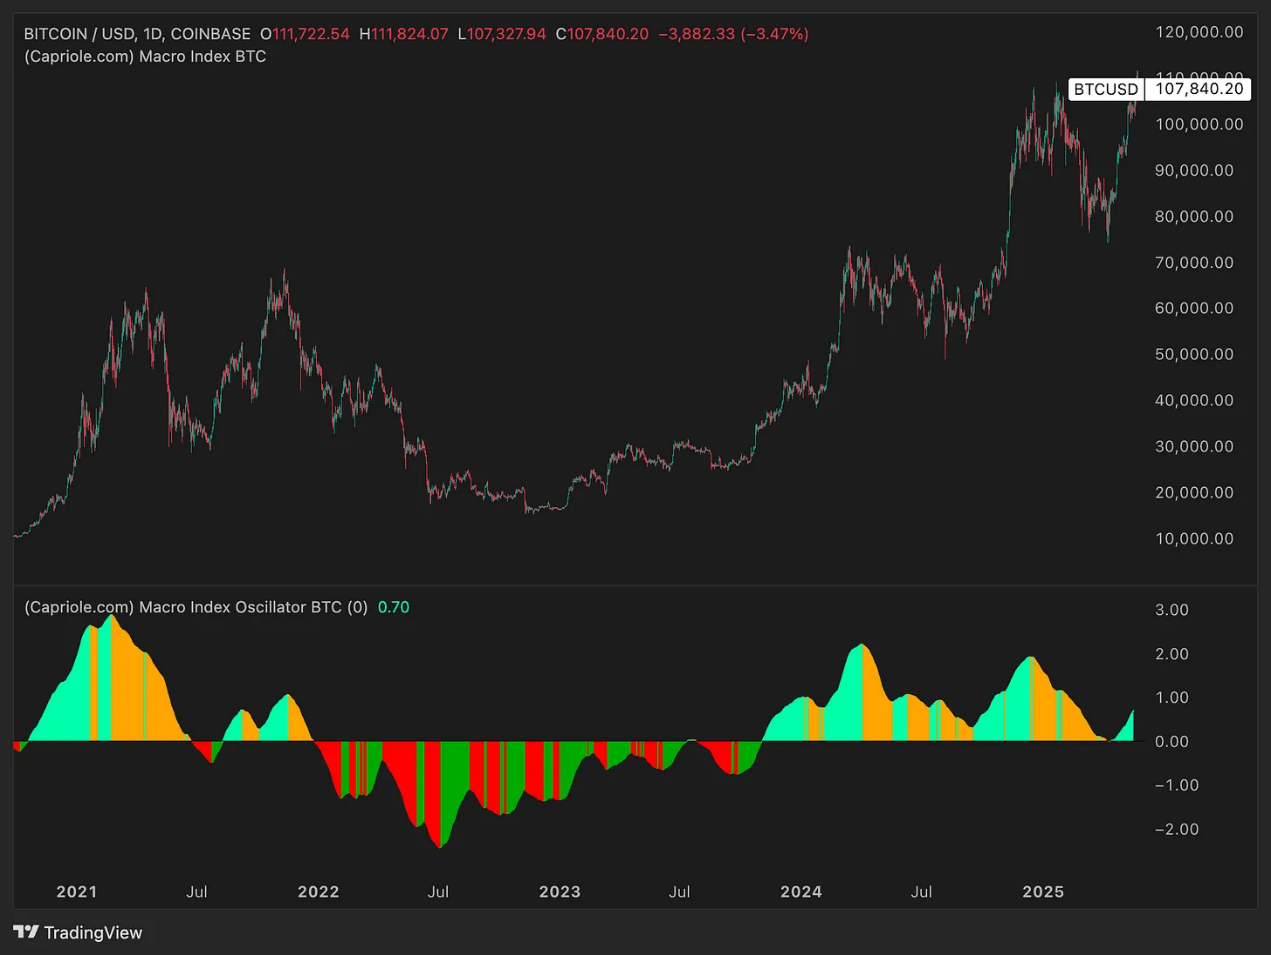
The composite index uses more than 40 fundamental, on-chain, and market indicators to assess the macro phase of Bitcoin. A reading above 0 indicates expansion; a reading below 0 indicates contraction or recovery.
In previous bull cycles, the indicator transitioned from negative territory to strongly positive territory - peaking near 2 to 3 in 2021. At the bottom in 2022, the indicator fell below -1. As of now, the Macro Index is around +0.7 - clearly in the growth phase, but still well below the extreme levels of mania.
This means that the cycle is likely in the middle of an expansion. The indicator is expected to climb above 2.0 as the cycle progresses toward the end of 2025. Bitcoin still has room to rise before core network activity stagnates or reverses. There are no signs of exhaustion yet.
Volume Summer (Liquidity / Participation)
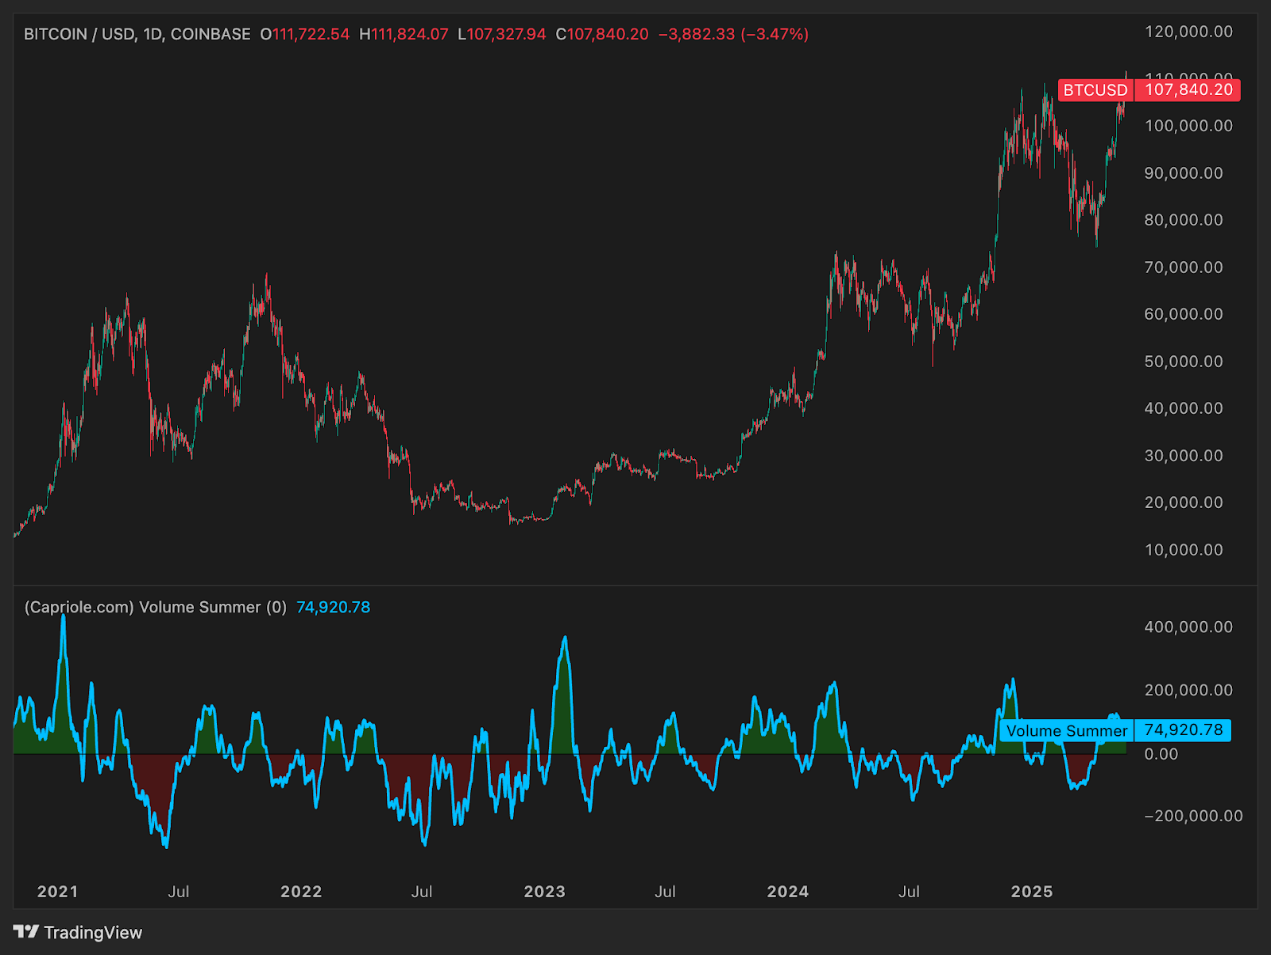
Volume Summer aggregates net buy-side volume in the spot and derivatives markets. A reading above zero indicates net inflows, while a reading below zero indicates net outflows or a decrease in trading activity.
In early 2021, the indicator soared into the bright green zone - a sign of retail FOMO and frenetic participation. In 2022, the indicator fell sharply into the red zone, confirming a massive withdrawal of funds.
The Volume Summer indicator is currently moderately positive (around +75k) - bullish, but far from manic. This means that money is returning, but the peak liquidity phase may still be ahead (Q4 2025?). If this indicator surges into the dark green zone again, expect a surge.
At current levels, liquidity is supportive – but far from its peak. There is still more momentum to drive further gains.
Open Interest / Market Value Ratio ( OI/Mcap )
The metric, which measures leverage relative to market value, hovered between 2% and 3% in 2021. In 2023, it surged to about 4%, setting the stage for a correction in mid-2024. After the market plunge, the metric reset to 2%, clearing out excess leverage.
By mid-2025, it has risen back to about 3.5%. This suggests that leverage is rising again. While this is good for the market in the short term (providing more momentum for the rally), it also increases risk. If it rises above 4% - 5% by the end of the year, it could signal a crowded and unstable market, prone to selling waves.
The final phase of this cycle will likely be marked by record leverage, which hit new highs when prices peaked. However, there is still room to rise.
Possible trends of BTC in December this year
Taking all indicators into consideration, it is expected that BTC is in the core stage of the bull cycle, but it is not yet close to the end.
There are no signs of extreme overvaluation. Most indicators show strong growth, but still below historical cycle tops.
The base case is therefore that BTC will reach between $210,000 and $230,000 by the end of 2025, more than double its current level. Based on these valuations, it is expected that:
- MVRV Z-Score > 7
- Energy Value Oscillator > +100%
- Bitcoin Heater is about to reach 1.0
- Volume Summer is in the excitement zone
- OI/Mcap at historically extreme levels
Only then will it be possible for the market to transition from the expansion phase to the distribution phase.
Related reading: After Bitcoin hits a record high, what are the four major catalysts for subsequent market trends?


Potrebbe anche piacerti

68% of global BTC miners came from the U.S., Russia, and China, Q1 2026

Franklin Templeton CEO Dismisses 50bps Rate Cut Ahead FOMC


