Ethereum Price Attempts Fresh Recovery as Bullish Pressure Builds
Ethereum price started a recovery wave above $2,880. ETH might gain bullish momentum if it manages to settle above the $3,000 resistance.
- Ethereum started a recovery wave above $2,850 and $2,880.
- The price is trading above $2,900 and the 100-hourly Simple Moving Average.
- There was a break above a key bearish trend line with resistance at $2,950 on the hourly chart of ETH/USD (data feed via Kraken).
- The pair could continue to move up if it settles above the $3,000 zone.
Ethereum Price Eyes Upside Break
Ethereum price managed to stay above $2,750 and started a recovery wave, like Bitcoin. ETH price was able to climb above the $2,800 and $2,850 levels.
The bulls were able to push the price above the 61.8% Fib retracement level of the downward move from the $3,058 swing high to the $2,620 low. Besides, there was a break above a key bearish trend line with resistance at $2,950 on the hourly chart of ETH/USD.
Ethereum price is now trading above $2,840 and the 100-hourly Simple Moving Average. It is also above the 76.4% Fib retracement level of the downward move from the $3,058 swing high to the $2,620 low.
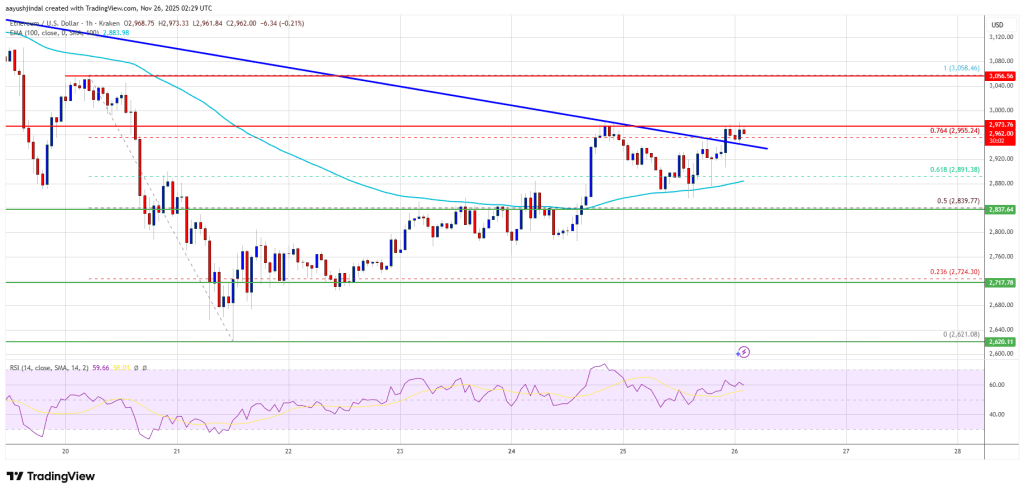
If there is another recovery wave, the price could face resistance near the $2,980 level. The next key resistance is near the $3,000 level. The first major resistance is near the $3,060 level. A clear move above the $3,060 resistance might send the price toward the $3,150 resistance. An upside break above the $3,150 region might call for more gains in the coming days. In the stated case, Ether could rise toward the $3,220 resistance zone or even $3,250 in the near term.
Another Decline In ETH?
If Ethereum fails to clear the $3,000 resistance, it could start a fresh decline. Initial support on the downside is near the $2,920 level. The first major support sits near the $2,880 zone.
A clear move below the $2,880 support might push the price toward the $2,800 support. Any more losses might send the price toward the $2,740 region in the near term. The next key support sits at $2,650 and $2,620.
Technical Indicators
Hourly MACD – The MACD for ETH/USD is gaining momentum in the bullish zone.
Hourly RSI – The RSI for ETH/USD is now above the 50 zone.
Major Support Level – $2,880
Major Resistance Level – $3,000


Potrebbe anche piacerti

Metaplanet Adds 5,075 Bitcoin in Q1, Lifts Treasury to 40,177 BTC

Trump drowning as supporters dismiss official story as FBI 'psyop'