

Was Yesterday’s Rally to $114K a Scam Pump and What’s Next for Bitcoin?
Bitcoin is holding near the lower end of its recent trading range after facing rejection at the $114,500 mark.
Market participants are now watching whether support around $108,000 can hold, as the price continues to move within a familiar range.
Bitcoin Trades Within a Defined Range
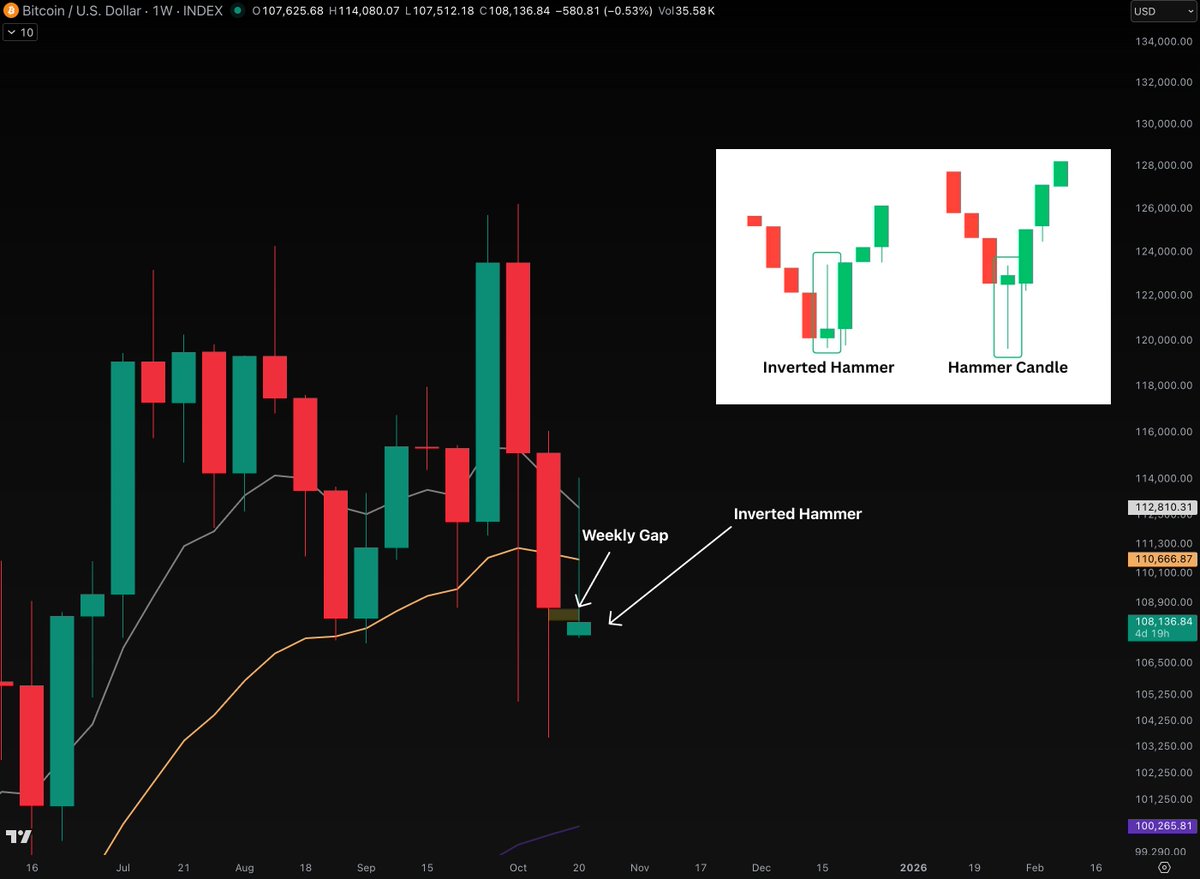
Bitcoin has remained in a sideways pattern, with buyers active near $108,000 and sellers capping moves at $114,500. On the weekly chart, the price is now sitting near $108,136 after being rejected from the top of the range. Analyst Rekt Capital said the current drop may still result in a higher low. He posted,
He also noted that Bitcoin is retesting past monthly levels that acted as resistance in September and could now serve as support. Despite the drop, the overall structure has not broken down and remains consistent with broader consolidation.
Inverted Hammer Appears Near Weekly Gap
A potential inverted hammer has formed on the weekly chart, according to analyst GandalfCrypto. The candle is taking shape just under a gap that spans from around $110,000 to $113,000. The pattern suggests buyers stepped in after early-week selling, though confirmation depends on how the candle closes.
GandalfCrypto explained,
A close above the current level may suggest buyer interest is returning, while failure to hold could result in more sideways action near the lows.
 Source: GandalfCrypto/X
On the shorter timeframes, momentum remains mixed. Daan Crypto Trades said Bitcoin’s recent attempt to reclaim the 4-hour 200MA/EMA failed, and the price dropped back to the daily 200MA and $107,000 area.
Lennaert Snyder is watching $107,260 as a possible entry point after a bounce, and noted that $105,600 could also be valid if support is confirmed. He added,
Market Eyes ETFs and Economic Data
Away from charts, CryptoPotato reported that large Bitcoin holders are moving assets into spot ETFs, giving them access to traditional financial platforms. These swaps are designed to be tax-neutral and avoid triggering taxable events.
Meanwhile, traders are watching low derivatives activity and the release of upcoming US inflation data, which could increase market volatility in the coming sessions.
The post Was Yesterday’s Rally to $114K a Scam Pump and What’s Next for Bitcoin? appeared first on CryptoPotato.


Potrebbe anche piacerti

Western Digital Jumps 7% on Morgan Stanley’s 33% Price-Target Hike, Seagate Gains 5% as the AI Storage Boom Rolls On

Crypto News: Early ETH and BTC Holders Wish They Bought More as Pepeto Fills Fast
'Why even bother?' Trump stuns after casually folding on 'his main justification' for war


Notizie di tendenza
Altro
