PEPE coin price has dropped nearly 40% from its September highs as it approaches a potential breakdown from a bearish head and shoulders pattern, which could spell more pain for holders in the days ahead. According to data from crypto.news,…PEPE coin price has dropped nearly 40% from its September highs as it approaches a potential breakdown from a bearish head and shoulders pattern, which could spell more pain for holders in the days ahead. According to data from crypto.news,…

PEPE coin price weakens as head and shoulders pattern emerges

2025/10/20 17:55
3 min di lettura
Per feedback o dubbi su questo contenuto, contattateci all'indirizzo crypto.news@mexc.com.

PEPE coin price has dropped nearly 40% from its September highs as it approaches a potential breakdown from a bearish head and shoulders pattern, which could spell more pain for holders in the days ahead.

Summary
  • PEPE price continued to extend losses on the weekly timeframe.
  • Whales and smart money holders have started exiting positions.
  • A bearish head and shoulder pattern is forming on the PEPE/USDT weekly chart.

According to data from crypto.news, Pepe (PEPE) coin dropped to a 6-month low of $0.0000063 on Friday, Oct. 17, before managing a slight recovery to $0.0000072 at the time of writing. At this price, the altcoin is down 40% from its September peak and has plunged nearly 66% from its highest point earlier this year.

Pepe coin price dropped 33% to $0.0000062 on Oct. 11 after U.S. President Donald Trump announced new tariffs on Chinese exports, reigniting trade war fears between the two major economies. 

The back-and-forth between Washington and Beijing has continued to unsettle global risk markets, including crypto, with several major cryptocurrencies shedding over 20% from their monthly gains as investors turned risk-averse.

Data from Blockchain analytics platform Nansen suggests Pepe’s price decline has been amplified by a steady exit of smart money and whale investors. Over the past 30 days, the total number of tokens held by smart money wallets has dropped by 38.6% to 1.95 trillion. At the same time, whale holdings have fallen from 6.13 trillion to 4.95 trillion during the same period.

The number of tokens held by whales and smart money has dropped significantly over the past 30 days.

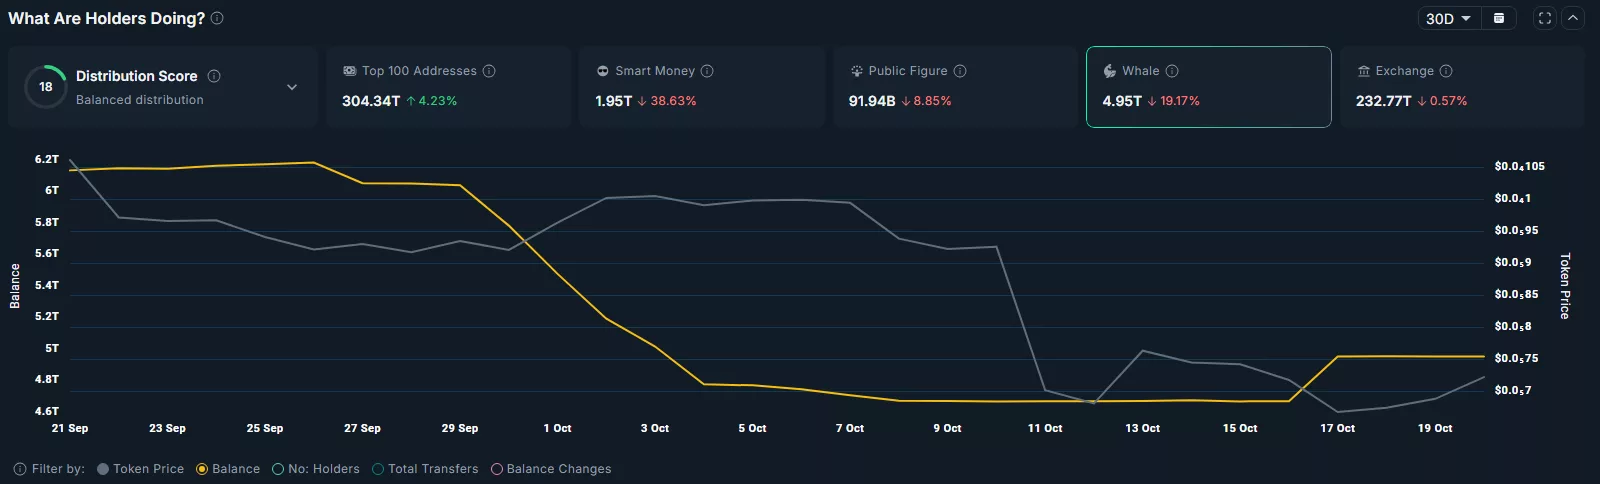
Such large-scale exits typically signal a market that is still in a state of uncertainty. Investors appear to be taking a wait-and-watch approach, probably holding out for clearer signs of stability before considering a possible reentry. 

If the selling continues, it could begin to weigh on retail investor sentiment as well, potentially triggering a broader wave of panic selling driven by fear rather than fundamentals.

Pepe price analysis

On the weekly chart, Pepe coin price has formed a textbook multi-year head and shoulders pattern, with the neckline hovering near $0.0000070 and the head topping out around $0.000028. This structure is often viewed as a strong bearish reversal signal, especially if the price breaks below the neckline with confirmation from other indicators.

PEPE coin price has formed a bearish head and shoulders on the weekly chart.

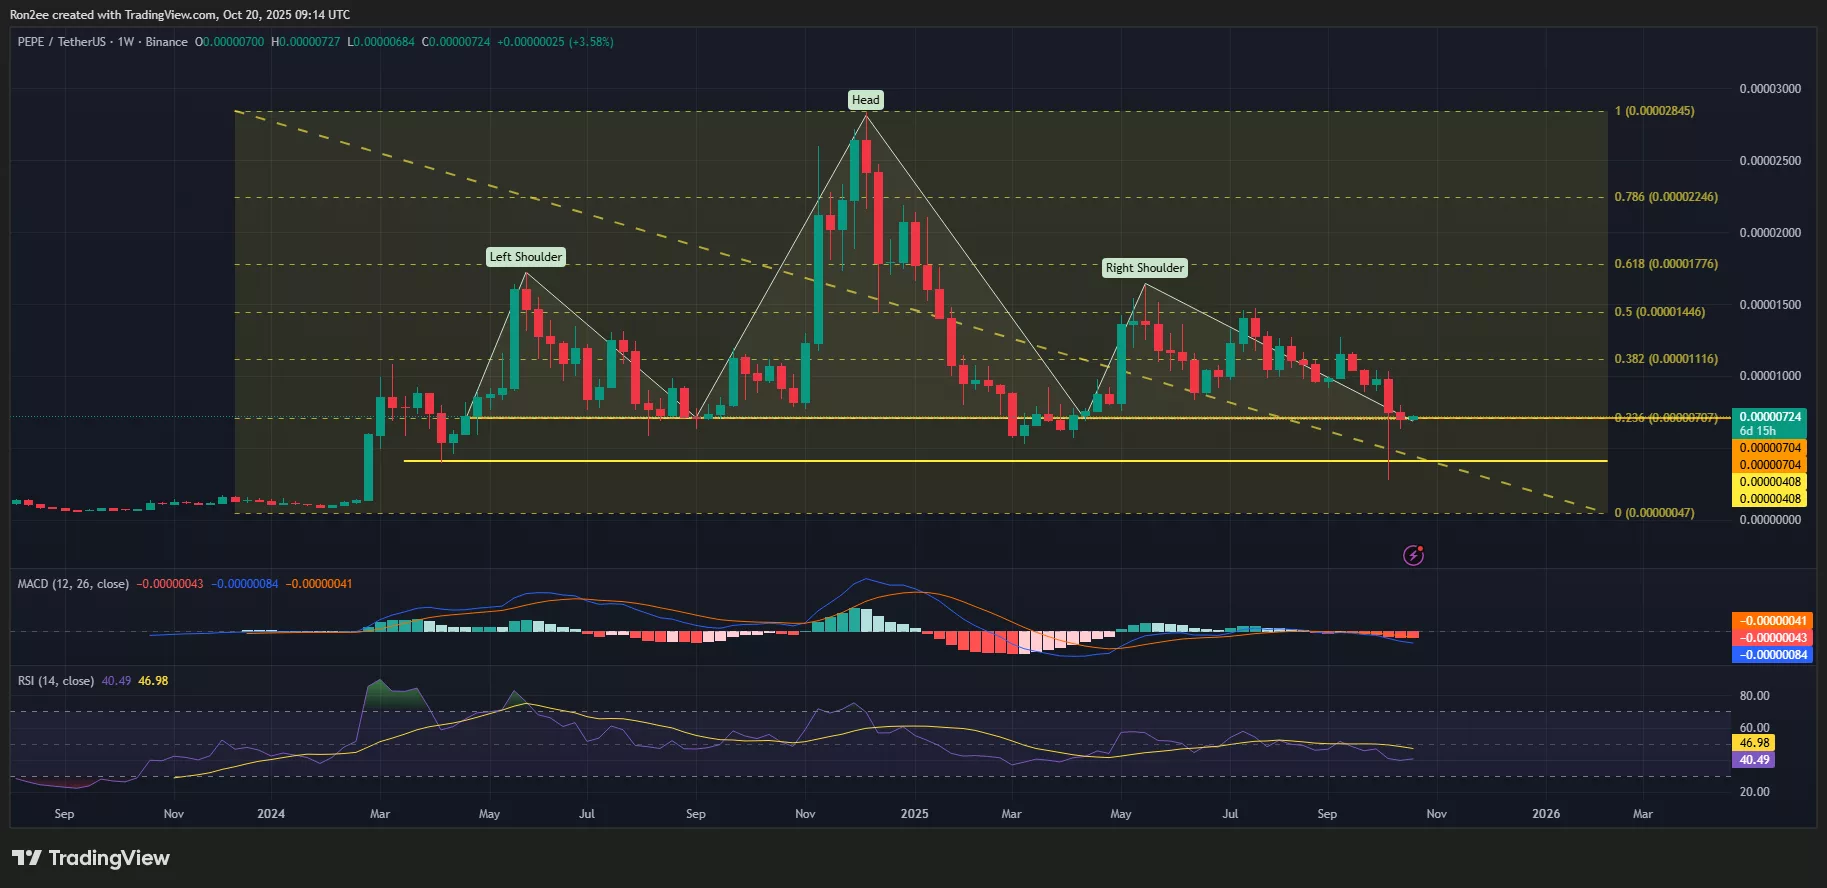
PEPE’s MACD line had crossed below the signal line when writing, which is a telltale sign that bearish momentum was gaining strength. Sellers assessing charts based on this signal may continue to apply pressure in the coming sessions.

Meanwhile, the RSI on the weekly timeframe was also heading downwards and had breached the neutral mark at 50, further reinforcing the bearish outlook among traders.

For now, the key support level to watch is at $0.0000070, which aligns with the 23.6% Fibonacci retracement. It stands 44% below the current price.

A clear break below this level, supported by rising trading volume, could open the doors for a deeper decline toward $0.0000040, particularly if overall market sentiment remains negative.

On the flip side, if bulls manage to defend the neckline and push prices higher, the first major resistance sits at $0.0000090. Decisively reclaiming that level could mark the end of the current downtrend and potentially signal an early shift in momentum in favor of buyers.

Disclosure: This article does not represent investment advice. The content and materials featured on this page are for educational purposes only.

Opportunità di mercato
Logo Pepe
Valore Pepe (PEPE)
$0.000003399
$0.000003399$0.000003399
+4.26%
USD
Grafico dei prezzi in tempo reale di Pepe (PEPE)
Disclaimer: gli articoli ripubblicati su questo sito provengono da piattaforme pubbliche e sono forniti esclusivamente a scopo informativo. Non riflettono necessariamente le opinioni di MEXC. Tutti i diritti rimangono agli autori originali. Se ritieni che un contenuto violi i diritti di terze parti, contatta crypto.news@mexc.com per la rimozione. MEXC non fornisce alcuna garanzia in merito all'accuratezza, completezza o tempestività del contenuto e non è responsabile per eventuali azioni intraprese sulla base delle informazioni fornite. Il contenuto non costituisce consulenza finanziaria, legale o professionale di altro tipo, né deve essere considerato una raccomandazione o un'approvazione da parte di MEXC.

Potrebbe anche piacerti

👨🏿‍🚀TechCabal Daily – Job cuts at Kuda

👨🏿‍🚀TechCabal Daily – Job cuts at Kuda

In today's edition: Kuda cuts jobs || Kenya won't raise existing tax rates || DHL to acquire three SA companies || New ID management system for Nigerian telecoms
Condividi
Techcabal2026/03/30 13:58
Cryptos Signal Divergence Ahead of Fed Rate Decision

Cryptos Signal Divergence Ahead of Fed Rate Decision

The post Cryptos Signal Divergence Ahead of Fed Rate Decision appeared on BitcoinEthereumNews.com. Crypto assets send conflicting signals ahead of the Federal Reserve’s September rate decision. On-chain data reveals a clear decrease in Bitcoin and Ethereum flowing into centralized exchanges, but a sharp increase in altcoin inflows. The findings come from a Tuesday report by CryptoQuant, an on-chain data platform. The firm’s data shows a stark divergence in coin volume, which has been observed in movements onto centralized exchanges over the past few weeks. Bitcoin and Ethereum Inflows Drop to Multi-Month Lows Sponsored Sponsored Bitcoin has seen a dramatic drop in exchange inflows, with the 7-day moving average plummeting to 25,000 BTC, its lowest level in over a year. The average deposit per transaction has fallen to 0.57 BTC as of September. This suggests that smaller retail investors, rather than large-scale whales, are responsible for the recent cash-outs. Ethereum is showing a similar trend, with its daily exchange inflows decreasing to a two-month low. CryptoQuant reported that the 7-day moving average for ETH deposits on exchanges is around 783,000 ETH, the lowest in two months. Other Altcoins See Renewed Selling Pressure In contrast, other altcoin deposit activity on exchanges has surged. The number of altcoin deposit transactions on centralized exchanges was quite steady in May and June of this year, maintaining a 7-day moving average of about 20,000 to 30,000. Recently, however, that figure has jumped to 55,000 transactions. Altcoins: Exchange Inflow Transaction Count. Source: CryptoQuant CryptoQuant projects that altcoins, given their increased inflow activity, could face relatively higher selling pressure compared to BTC and ETH. Meanwhile, the balance of stablecoins on exchanges—a key indicator of potential buying pressure—has increased significantly. The report notes that the exchange USDT balance, around $273 million in April, grew to $379 million by August 31, marking a new yearly high. CryptoQuant interprets this surge as a reflection of…
Condividi
BitcoinEthereumNews2025/09/18 01:01
Lido Eyes $20M Token Buyback as LDO Hits Deep Discount

Lido Eyes $20M Token Buyback as LDO Hits Deep Discount

Lido's DAO has proposed a one-off buyback of 10,000 stETH (about $20 million) to repurchase LDO governance tokens near their all-time low as the protocol cites
Condividi
Cryptonews AU2026/03/30 14:22