

Analyst Predicts 60% Bitcoin Flash Crash Below $50,000

Amid the calls for new all-time highs for Bitcoin, one analyst is going against the trend and calling a crash. The prediction not only expects Bitcoin to break below the $100,000 level, which many believe was already left in the past, but to actually fall by more than 60% from here. The analysis, which depicts a flash crash, shows a possible price reversal into levels not seen in years.
Entering A Bitcoin Short With Conviction
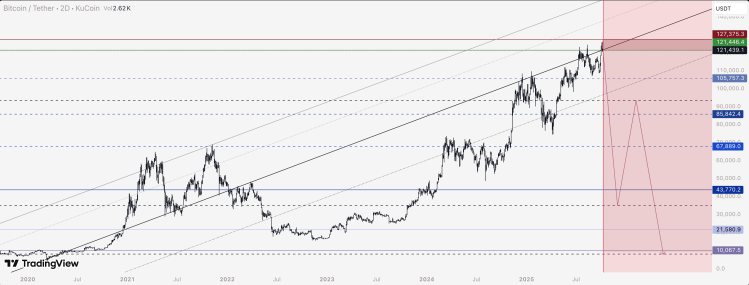
The crypto analyst who goes by the pseudonym Dick Dandy revealed that their next move was to enter into a Bitcoin short position between $121,400 and $121,700. However, the more interesting part is the take-profit targets that Dandy set for this position.
First of these lies at the $105,700 level, moving down all the way through to $85,800. From here, the crypto analyst expects the Bitcoin price to continue to crash until it falls below $50,000 and registers prices not seen since 2024. Falling to the $43,900 target would mean an over 60% decline in the price, but the analyst expects Bitcoin to crash further.
With the possibility that Bitcoin could see a recovery from $35,000, the analyst explains that they plan to open a long position to hedge their short. But maintains their belief in the fact that the Bitcoin price will continue to decline. Ultimately, Dandy believes that the Bitcoin price will eventually reach $10,000, which is the end of the target.
Anatomy Of The Crash Explained In Theory
In another post, Dandy explained the theory behind the Bitcoin flash crash as mostly a battle between traders and the market-makers. According to the analyst, market makers essentially enable crypto traders to utilize liquidity to enter leveraged positions. But ultimately, they want their money back while making sure that traders do not profit from their trades.
Such cases lead to rapid price movements, which have become known in the market as “stop hunts.” These work to take a large number of traders out of their positions very quickly by liquidating them, essentially returning the liquidity, and then some, back to the market makers.
As for why such a large move is possible, the analyst explains that this is because most of Bitcoin’s market cap is all liquidity used for leveraging and derivatives trading. In fact, the analyst believes that the “floor price” of Bitcoin lies around $8,000, taking into account the stable sources and dividing it by the “dispersed amount of bitcoin on the market.”
Dandy predicts that this move will happen very quickly, hence terming it a flash crash, and that traders will have very little time to react. “The more sell orders there are, and the greater the quantity of Bitcoin ordered to be sold, the faster price will drop down,” the analyst explained.
Potrebbe anche piacerti

US Treasury Turns to AI to Combat Crypto Fraud After $9B in Losses

‘Great Progress’: Cardano Founder Shares Update After CLARITY Act Roundtable
Read the full article at coingape.com.
