

Bitcoin Price Forecast: BTC edges lower following 50-day EMA rejection

- Bitcoin price trades in red on Thursday after failing to break above the 50-day EMA at $113,756 the previous day.
- US-listed spot Bitcoin ETFs recorded a modest inflow, but the historical 'September effect’ continues to weigh on sentiment.
- The US Senate Finance Committee schedules a hearing on October 1 to examine the taxation of digital assets.
Bitcoin (BTC) edges below $111,900 at the time of writing on Thursday after failing to close above key resistance the previous day, with broader market sentiment still under pressure. US-listed Bitcoin Exchange Traded Funds (ETFs) managed to see mild inflows on Wednesday, and the seasonal ‘September effect’ continues to weigh on sentiment.
Bitcoin declines despite mild positive inflows
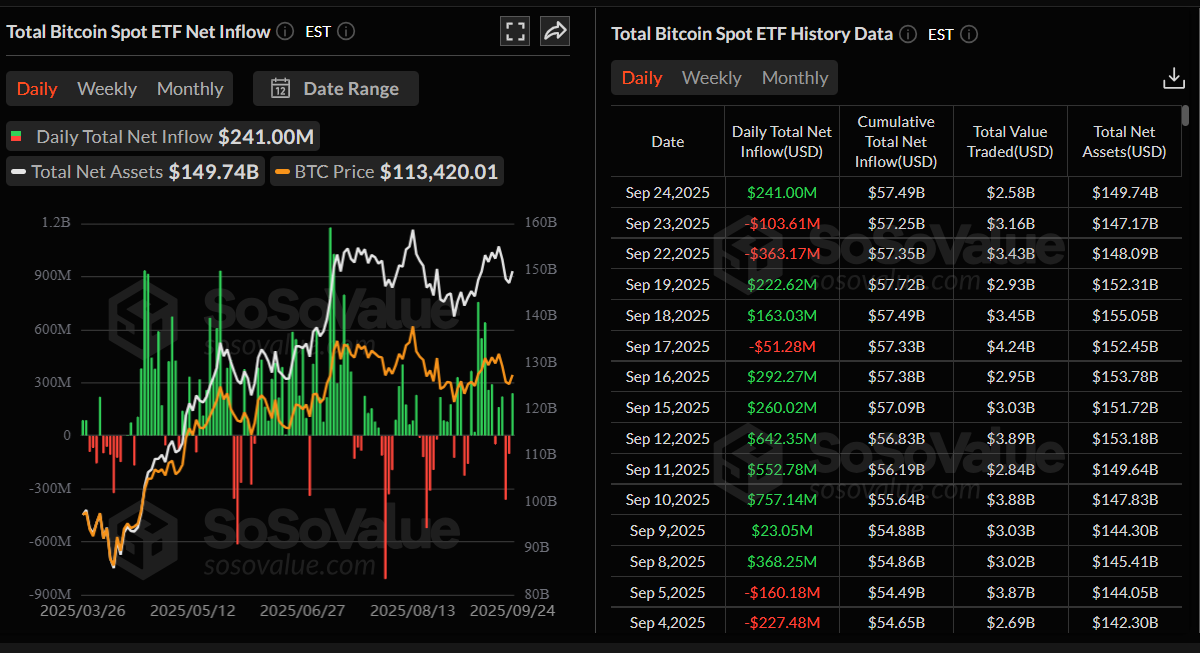
SoSoValue data shows that US-listed Bitcoin spot ETFs recorded a mild inflow of $241 million on Wednesday, breaking a two-day streak of outflows this week. However, the inflow values are small compared to those seen during mid-September, when BTC recovered from the August fall. If these inflows continue and intensify, BTC could see a recovery ahead.
QCP Capital’s report on Thursday highlighted that despite the sell-off, institutional demand shows little sign of fading. Dip buying remains evident, with October 118,000 BTC calls dominating daily options activity.
The 'September effect' still weighs on Bitcoin
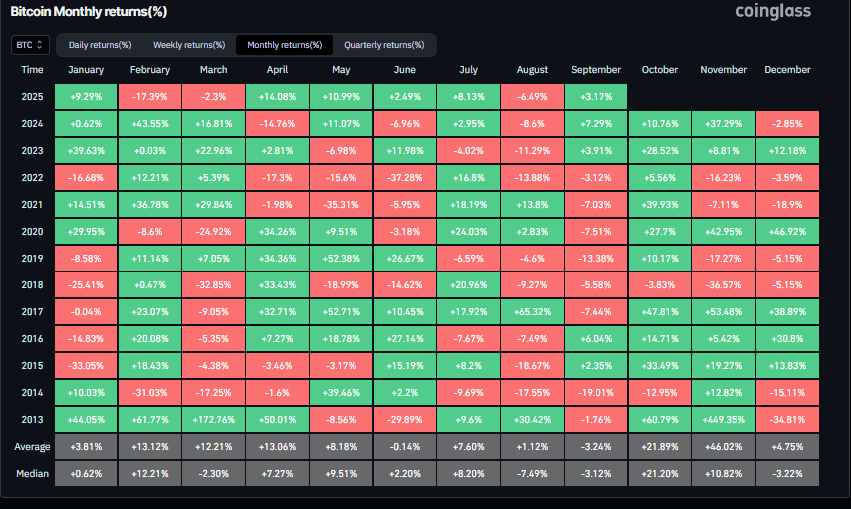
CoinGlass’s historical monthly return (%) data shows that September has generally delivered negative returns for Bitcoin, averaging -3.24%. While BTC is up 3.17% so far this month, traders should remain cautious as history suggests the month could still close in the red.
QCP Capital’s analyst said on the report, “As Q4 approaches, historically a more constructive period, optimism persists, supported by looser credit conditions. Markets are pricing in two further rate cuts of 25 bps in October and December. Unless next week’s non-farm payrolls surprises on the upside, that narrative is likely to hold.”
US Senate Finance Committee to hold hearing on crypto asset taxation
The US Senate Finance Committee has scheduled a hearing to examine the taxation of crypto assets for October 1.
Chairman Mike Crapo announced on Wednesday that the Committee will convene for a hearing entitled “Examining the Taxation of Digital Assets”.
This announcement is a positive development for cryptocurrencies in the US, as it provides more regulatory clarity regarding the setting of tax rules for digital assets and could attract wider adoption of crypto in the country.
Bitcoin Price Forecast: BTC faces rejection from the 50-day EMA
Bitcoin price failed to find support around the daily level of $116,000 on September 19 and declined 3.19% over the next four days, closing below the 50-day Exponential Moving Average at $113,762 on Monday. BTC recovered slightly on Wednesday, but failed to close above the 50-day EMA. At the time of writing on Thursday, it trades down at around $111,900.
If BTC continues its ongoing correction, it could extend its decline to retest the next daily support at $107,245.
The Relative Strength Index (RSI) on the daily chart reads 42, below its neutral level of 50, indicating bearish momentum. Meanwhile, the Moving Average Convergence Divergence (MACD) indicator showed a bearish crossover on Monday, giving a sell signal, which is still in effect. Moreover, the rising red histogram bars below the neutral level also suggest a bearish momentum and continuation of the downward trend.
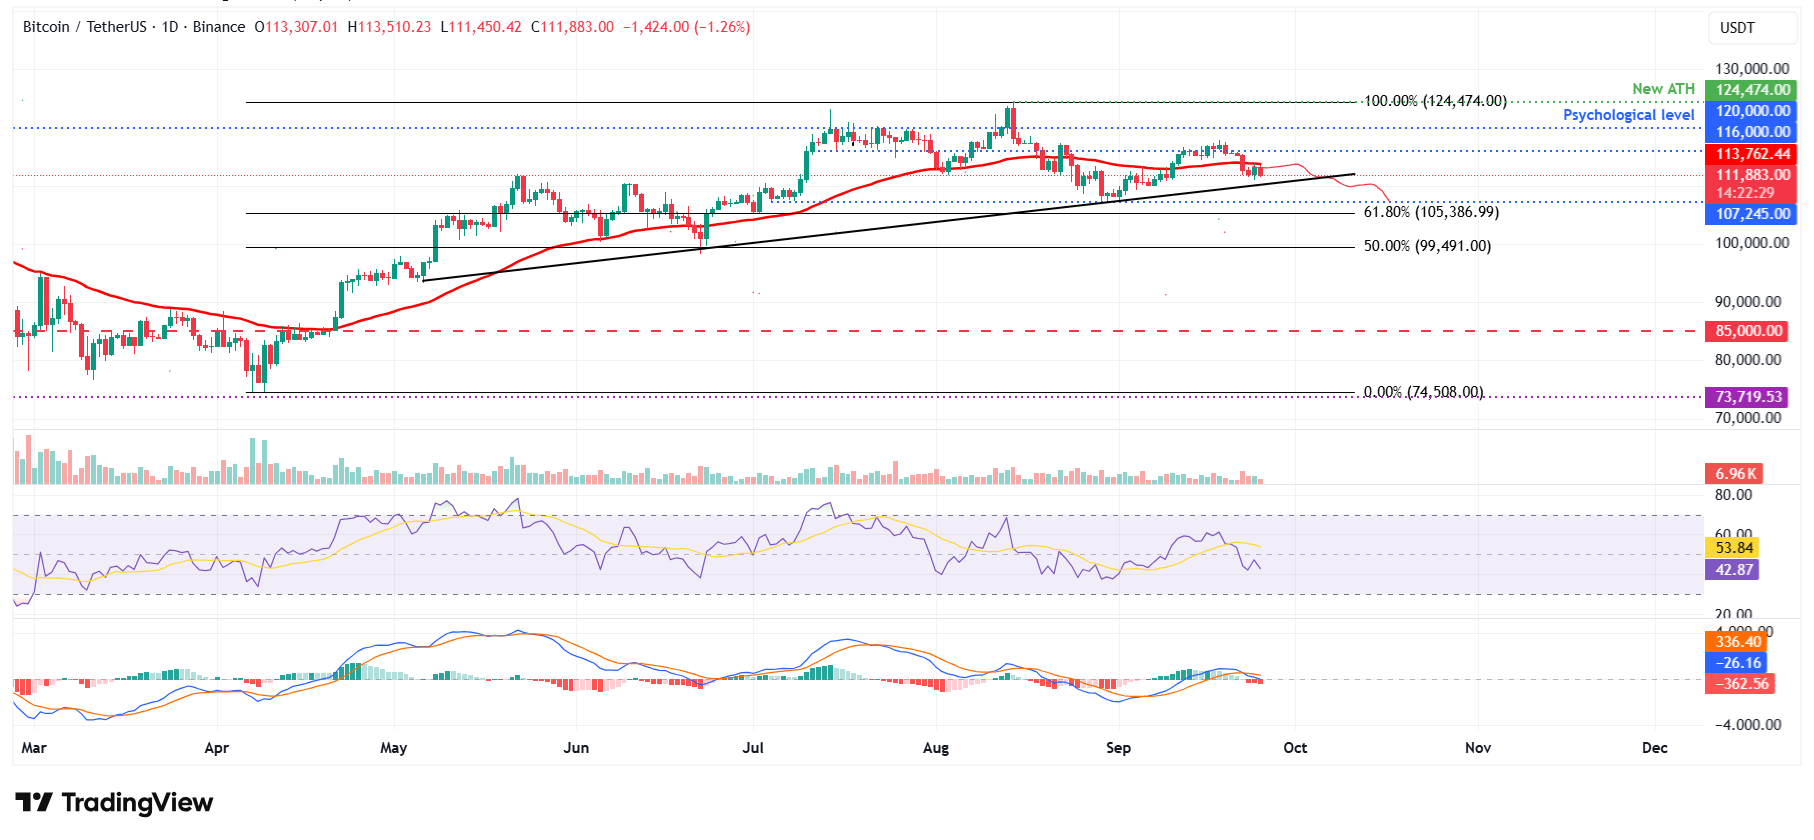
BTC/USDT daily chart
However, if BTC closes above the 50-day EMA at $113,762 on a daily basis, it could extend the rally toward the daily resistance at $116,000.
Bitcoin, altcoins, stablecoins FAQs
Bitcoin is the largest cryptocurrency by market capitalization, a virtual currency designed to serve as money. This form of payment cannot be controlled by any one person, group, or entity, which eliminates the need for third-party participation during financial transactions.
Altcoins are any cryptocurrency apart from Bitcoin, but some also regard Ethereum as a non-altcoin because it is from these two cryptocurrencies that forking happens. If this is true, then Litecoin is the first altcoin, forked from the Bitcoin protocol and, therefore, an “improved” version of it.
Stablecoins are cryptocurrencies designed to have a stable price, with their value backed by a reserve of the asset it represents. To achieve this, the value of any one stablecoin is pegged to a commodity or financial instrument, such as the US Dollar (USD), with its supply regulated by an algorithm or demand. The main goal of stablecoins is to provide an on/off-ramp for investors willing to trade and invest in cryptocurrencies. Stablecoins also allow investors to store value since cryptocurrencies, in general, are subject to volatility.
Bitcoin dominance is the ratio of Bitcoin's market capitalization to the total market capitalization of all cryptocurrencies combined. It provides a clear picture of Bitcoin’s interest among investors. A high BTC dominance typically happens before and during a bull run, in which investors resort to investing in relatively stable and high market capitalization cryptocurrency like Bitcoin. A drop in BTC dominance usually means that investors are moving their capital and/or profits to altcoins in a quest for higher returns, which usually triggers an explosion of altcoin rallies.
Potrebbe anche piacerti

US Treasury Turns to AI to Combat Crypto Fraud After $9B in Losses

‘Great Progress’: Cardano Founder Shares Update After CLARITY Act Roundtable
Read the full article at coingape.com.
