

Strategy CEO Says No Bitcoin Sale till 2065 Despite BTC Losing $90K Support
Bitcoin declined below $90,000 on Saturday after more than $500 million of liquidations swept the market on Friday. The forced unwinds amplified weekend volatility, exposing the correlation between thinning liquidity and larger directional moves when U.S. markets close.
As Bitcoin’s detour below $90,000 sparks concerns, Strategy, the largest corporate BTC holder, took to the media to address negative market sentiment. Strategy CEO Phong Lee told CNBC’s ‘Power Lunch’ crew on Saturday that the company would not sell its Bitcoin until 2065 unless extraordinary conditions forced a change.
He stressed that the company had recently raised capital to introduce dollar assets to its balance sheet to address concerns about dividend obligations and margin risk.
The commentary appears to have steadied sentiment, with BTC trading volume down roughly 4% signalling that sellers are taking a step back as BTC price stabilizes near $89,691 at the time of writing.
Bitcoin Price Forecast: Cup-and-Handle Intact, Can BTC Reclaim $100k to Confirm Upside
Bitcoin price sits at $89,691 and is trading within a larger cup-and-handle base that formed over the past 18 months. The chart shows a valid continuation structure, and the handle retracement provided a clean reset for mean reversion. Key technical indicators show that BTC is trading below the Bollinger midline, which is now the first level of resistance.
A sustained move above the middle band at ~$100,308 signals a return to trend control and typically coincides with increased volatility to the upside. The cup-and-handle measured projection on the chart targets roughly $130,00, but Bitcoin must first clear the initial resistance near the upper Bollinger band at $120,000.
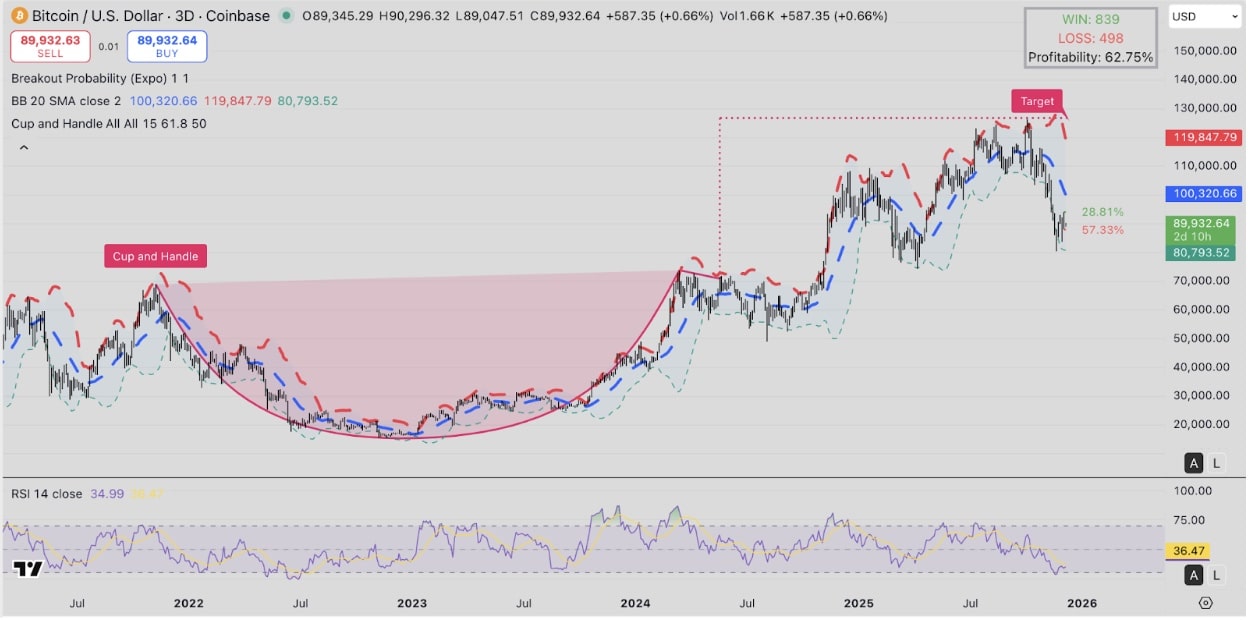
Bitcoin (BTC) technical analysis, Dec 6, 2025 | Source: Tradingview
The market win-loss ratio places chances of a Bitcoin rebound above $100,000 at 28.8%, against a 57% odds of another leg-lower to last month’s lows near $82,000
More so, the RSI at 34.6 signals the market was recently oversold inside the larger bullish base. A rising RSI through its 14-period moving average (~36.4) would confirm improving momentum and support a run to the Bollinger mid and beyond.
In the bull case, Bitcoin price must hold above the lower Bollinger band $80,755, and reclaim $100,308 on the daily candle. From there, a sustained volume uptick could push the BTC price toward $120,000. Failure to hold the lower band $80,755 on a decisive daily close would invalidate the immediate bullish continuation, heightening the risk of a deeper correction toward $70,000.
nextThe post Strategy CEO Says No Bitcoin Sale till 2065 Despite BTC Losing $90K Support appeared first on Coinspeaker.
You May Also Like

Trump Statue Holding Bitcoin Unveiled Near U.S. Capitol as Crypto Politics Heat Up

UNI Price Prediction: Critical Support Test at $5.37 – Next Target $7.88 by January 2025
