The crypto market had a good start to the week but has slipped into the red on December 5. The recent downturn in Bitcoin has led to dips across major altcoins. Crypto liquidations and futures market activity have also seen negative changes in the last 24 hours due to this decline.
Why the Crypto Market Is Declining Today
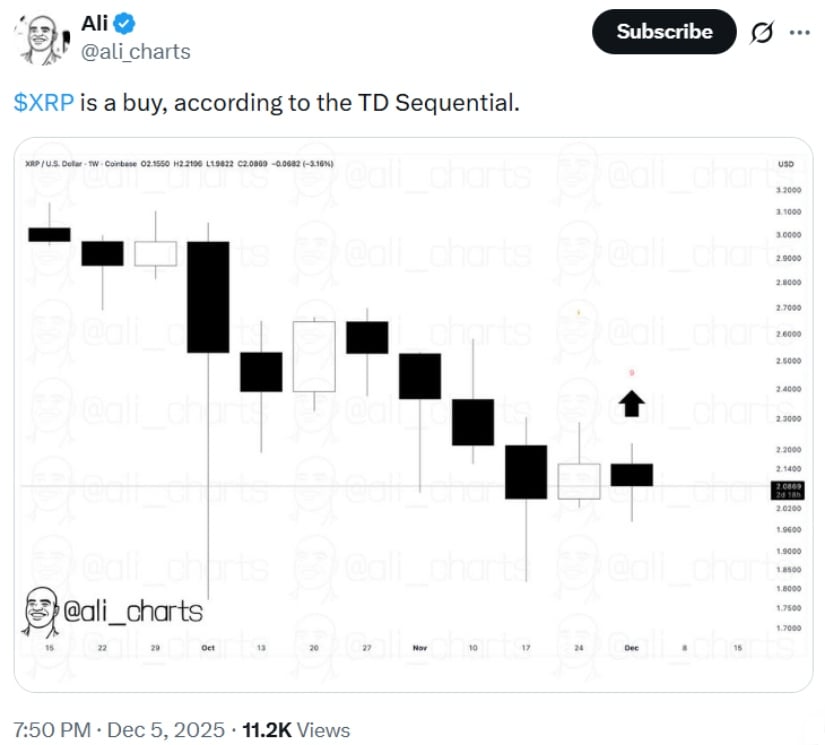
According to data from TradingView, the total crypto market cap is down almost 2% in the last 24 hours, dropping to $3.14 trillion. Bitcoin led the downturn after falling more than 1% in the past 24 hours. The major altcoins have seen more significant losses with XRP, Solana and Dogecoin falling over 3%.
Source: TradingView; Crypto Market Daily ChartData from CoinGlass indicates that traders accounted for $286.5 million in liquidations over the last day. Long positions suffered the most, losing $209.62 million, while short traders lost $76.89 million.
Source: CoinGlass;24-hour Crypto liquidationsEven with increased selling, some of the major players moved funds off exchanges. If Matrixport alone withdrew 3,805 BTC from Binance within 24 hours, it goes to say that investors might be shifting toward self-custody rather than exiting the market altogether.
Is Bitcoin’s 30% Drawdown Setting Up the Next Rebound?
While the decline in the crypto market seems steep, Bitcoin’s almost 30% fall from its all-time high is largely in line with historical behavior. Data shows that the market often goes through corrections of 30-40% over time.
Bitcoin dropped as low as $80,000 late last month before rising again and falling this week. At its lowest, it had shed about 26% from $126,000.
The decline fits into a long history of sharp corrections that have happened in past market cycles. For example, the crypto slid 32.7% between March and August 2024, and then came another 31.7% pullback from January to April 2025. Analysts say these pullbacks are usually followed by strong recoveries.
Also, Futures open interest has fallen 1.87% to $132 billion. This means that traders are scaling back leverage. Liquidations in the futures market dropped by 27% from the previous day to $267 million. When open interest is lower, it usually means there is less demand, which can lead to weaker price trends.
Source: Coinglass; Open Interest ChartFear Remains Despite Positive Developments
Despite several positive developments, the Fear and Greed Index has surged from last month’s extreme fear level of 8 and remains firmly in the fear zone at 25.
Some news should have given a boost to the market this week. An example is Vanguard announcing its plans to start trading crypto ETFs.
There were also reports that President Donald Trump would appoint Kevin Hassett as the new Fed Chair. To add, the Fed could eventually make another rate cut this month.
Source: https://coingape.com/why-is-crypto-market-down-today-dec-5/