The negative outlook of the crypto market has resulted in a 1.14% loss, pushing the market cap down toward $3.13 trillion. With the bears staying here, the digital assets are supposed to lose momentum. All the major tokens are struck in the red waves, attempting the escape.  Notably, the overallThe negative outlook of the crypto market has resulted in a 1.14% loss, pushing the market cap down toward $3.13 trillion. With the bears staying here, the digital assets are supposed to lose momentum. All the major tokens are struck in the red waves, attempting the escape.  Notably, the overall

Zcash (ZEC) Ignites an 11% Jump: Bullish Revival Ahead or a Bearish Trap in Disguise?

2025/12/05 15:06
  • The 11% gain has pushed Zcash to trade at $398.
  • ZEC’s trading volume has dropped by over 15%.

The negative outlook of the crypto market has resulted in a 1.14% loss, pushing the market cap down toward $3.13 trillion. With the bears staying here, the digital assets are supposed to lose momentum. All the major tokens are struck in the red waves, attempting the escape. 

Notably, the overall market sentiment is lingering in fear, with the Fear and Greed Index value holding at 25. The largest assets, like BTC and ETH, are trading on the downside. Meanwhile, Zcash (ZEC) is one of the trending coins, posting a gain of over 11.78%. 

ZEC’s daily low and high were noted at $347.73 and $402.16, respectively. If the ongoing upswing strengthens, the bulls will assist the price movement to hit new highs. Zcash is currently trading at around the $398.86 mark, with its market cap at $6.56 billion.

Besides, the daily trading volume of the asset has dropped by over 15.18%, reaching the $1.19 billion zone. The Coinglass data has reported that the market has experienced an event of liquidation of $7.08 million worth of Zcash in the last 24 hours.

Where Is Zcash Headed From Here?

Zcash’s Moving Average Convergence Divergence and signal lines are below the zero line, showing overall bearish momentum. But the MACD is trying to cross above, indicating an early bullish shift, even though the broader trend remains weak. 

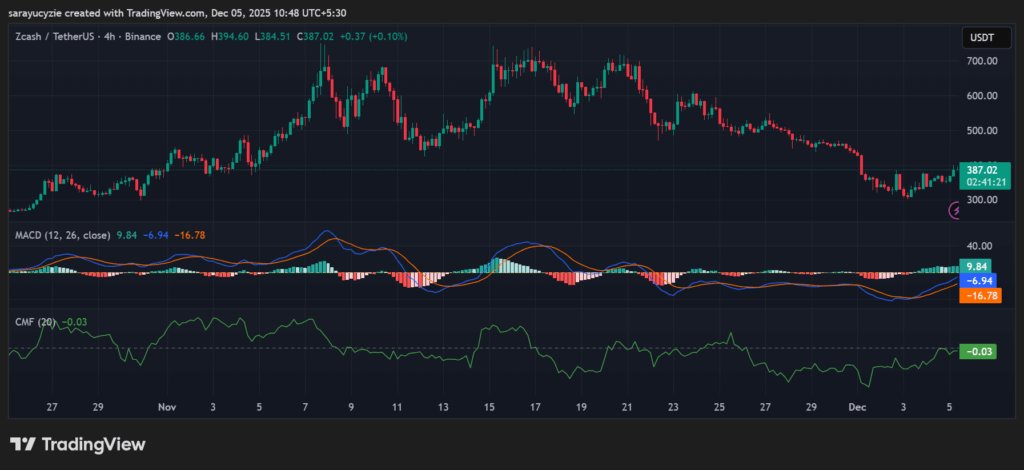
ZEC chart (Source: TrdaingView)

In addition, the Chaikin Money Flow (CMF) indicator at -0.03 suggests slightly bearish money flow, but it is very close to the neutral zone. The selling pressure is weak in the ZEC market, not strong enough to confirm heavy distribution.

Assuming the Zcash price falls to its nearest support level at $390.37, a potential downside correction might take place. Eventually, the bears may trigger the emergence of a death cross and send the price to $382.49 or even lower.

Upon a reversal, the price of the asset might climb to the resistance at around $406.87. If the upside pressure gains more traction, the bulls initiate the formation of the golden cross, likely driving the Zcash price above the $414.75 range. 

Moreover, the daily Relative Strength Index (RSI) at 53.90 signals a neutral to slightly bullish momentum. ZEC is not overbought or oversold, and a drop below 50 could shift the momentum. Zcash’s Bull Bear Power (BBP) reading of 50.18 is strong, hinting that the bulls are having a clear dominance in the market. Also, the buyers have a solid advantage.

Top Updated Crypto News

Critical Security Flaw Discovered in Solana Seeker Smartphone Chip

Disclaimer: The articles reposted on this site are sourced from public platforms and are provided for informational purposes only. They do not necessarily reflect the views of MEXC. All rights remain with the original authors. If you believe any content infringes on third-party rights, please contact service@support.mexc.com for removal. MEXC makes no guarantees regarding the accuracy, completeness, or timeliness of the content and is not responsible for any actions taken based on the information provided. The content does not constitute financial, legal, or other professional advice, nor should it be considered a recommendation or endorsement by MEXC.

You May Also Like

Polygon Tops RWA Rankings With $1.1B in Tokenized Assets

Polygon Tops RWA Rankings With $1.1B in Tokenized Assets

The post Polygon Tops RWA Rankings With $1.1B in Tokenized Assets appeared on BitcoinEthereumNews.com. Key Notes A new report from Dune and RWA.xyz highlights Polygon’s role in the growing RWA sector. Polygon PoS currently holds $1.13 billion in RWA Total Value Locked (TVL) across 269 assets. The network holds a 62% market share of tokenized global bonds, driven by European money market funds. The Polygon POL $0.25 24h volatility: 1.4% Market cap: $2.64 B Vol. 24h: $106.17 M network is securing a significant position in the rapidly growing tokenization space, now holding over $1.13 billion in total value locked (TVL) from Real World Assets (RWAs). This development comes as the network continues to evolve, recently deploying its major “Rio” upgrade on the Amoy testnet to enhance future scaling capabilities. This information comes from a new joint report on the state of the RWA market published on Sept. 17 by blockchain analytics firm Dune and data platform RWA.xyz. The focus on RWAs is intensifying across the industry, coinciding with events like the ongoing Real-World Asset Summit in New York. Sandeep Nailwal, CEO of the Polygon Foundation, highlighted the findings via a post on X, noting that the TVL is spread across 269 assets and 2,900 holders on the Polygon PoS chain. The Dune and https://t.co/W6WSFlHoQF report on RWA is out and it shows that RWA is happening on Polygon. Here are a few highlights: – Leading in Global Bonds: Polygon holds 62% share of tokenized global bonds (driven by Spiko’s euro MMF and Cashlink euro issues) – Spiko U.S.… — Sandeep | CEO, Polygon Foundation (※,※) (@sandeepnailwal) September 17, 2025 Key Trends From the 2025 RWA Report The joint publication, titled “RWA REPORT 2025,” offers a comprehensive look into the tokenized asset landscape, which it states has grown 224% since the start of 2024. The report identifies several key trends driving this expansion. According to…
Share
BitcoinEthereumNews2025/09/18 00:40