

Next Key XRP Level Could Be $1.2 If Current Support Fails, Says Analyst
A cryptocurrency analyst has pointed out how the next XRP support may be $1.2 if the lower level of the asset’s Parallel Channel breaks down.
XRP Is Currently Above A Parallel Channel’s Support Level
In a new post on X, analyst Ali Martinez has shared a pattern that has been forming in the 3-day price of XRP. The pattern in question is a Parallel Channel, a type of consolidation channel in technical analysis (TA).
A Parallel Channel appears whenever an asset’s price consolidates between two parallel trendlines. The upper level of the pattern tends to be a source of resistance, while the lower one that of support. Together, the two lines keep the asset locked in the range between them.
Either of the levels not holding up can imply a continuation of the trend in that direction. This breakout is bullish when the price breaks the upper level, while bearish in the case of the lower one.
Based on how the channel is aligned relative to the graph axes, Parallel Channels can be divided into a few types. The Ascending Channel corresponds to the case when the channel has a positive slope. Similarly, the Descending Channel is the type where consolidation occurs to a net downside.
The channel that XRP has been following over the past year falls in neither category, however, as it belongs to the third and simplest case: a Parallel Channel that’s also parallel to the time-axis. This pattern naturally signifies a phase of true sideways movement in the price.
Now, here is the chart shared by Martinez that shows the Parallel Channel that the 3-day price of XRP is trading inside:
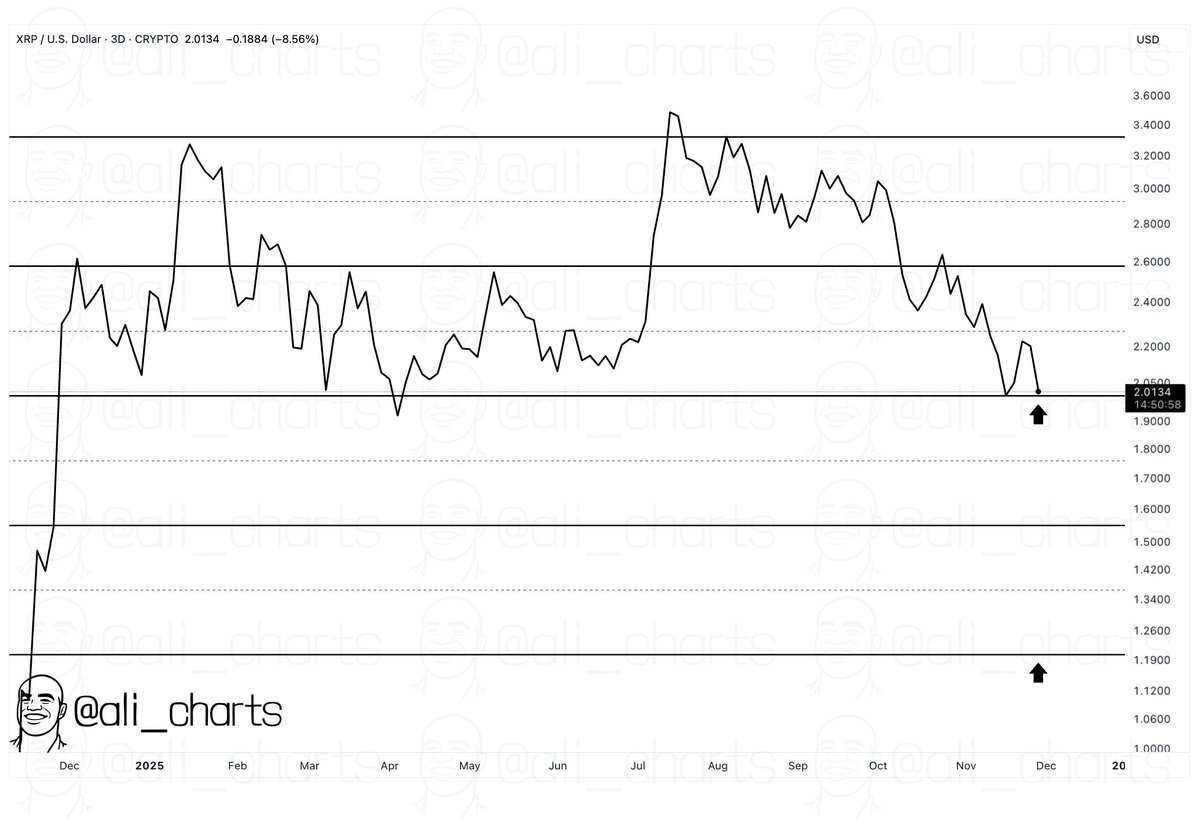
As displayed in the above graph, the 3-day XRP price recently retested the Parallel Channel’s lower level situated at $2. The coin has since rebounded, indicating that support is holding for now.
In the scenario that the coin returns to the level and a retest fails, the analyst has noted that the next level that stands out is the $1.2 level. This level and the support line are separated by the same distance as the height of the Parallel Channel. It now remains to be seen how XRP will develop in the near future and whether the rebound will continue to hold.
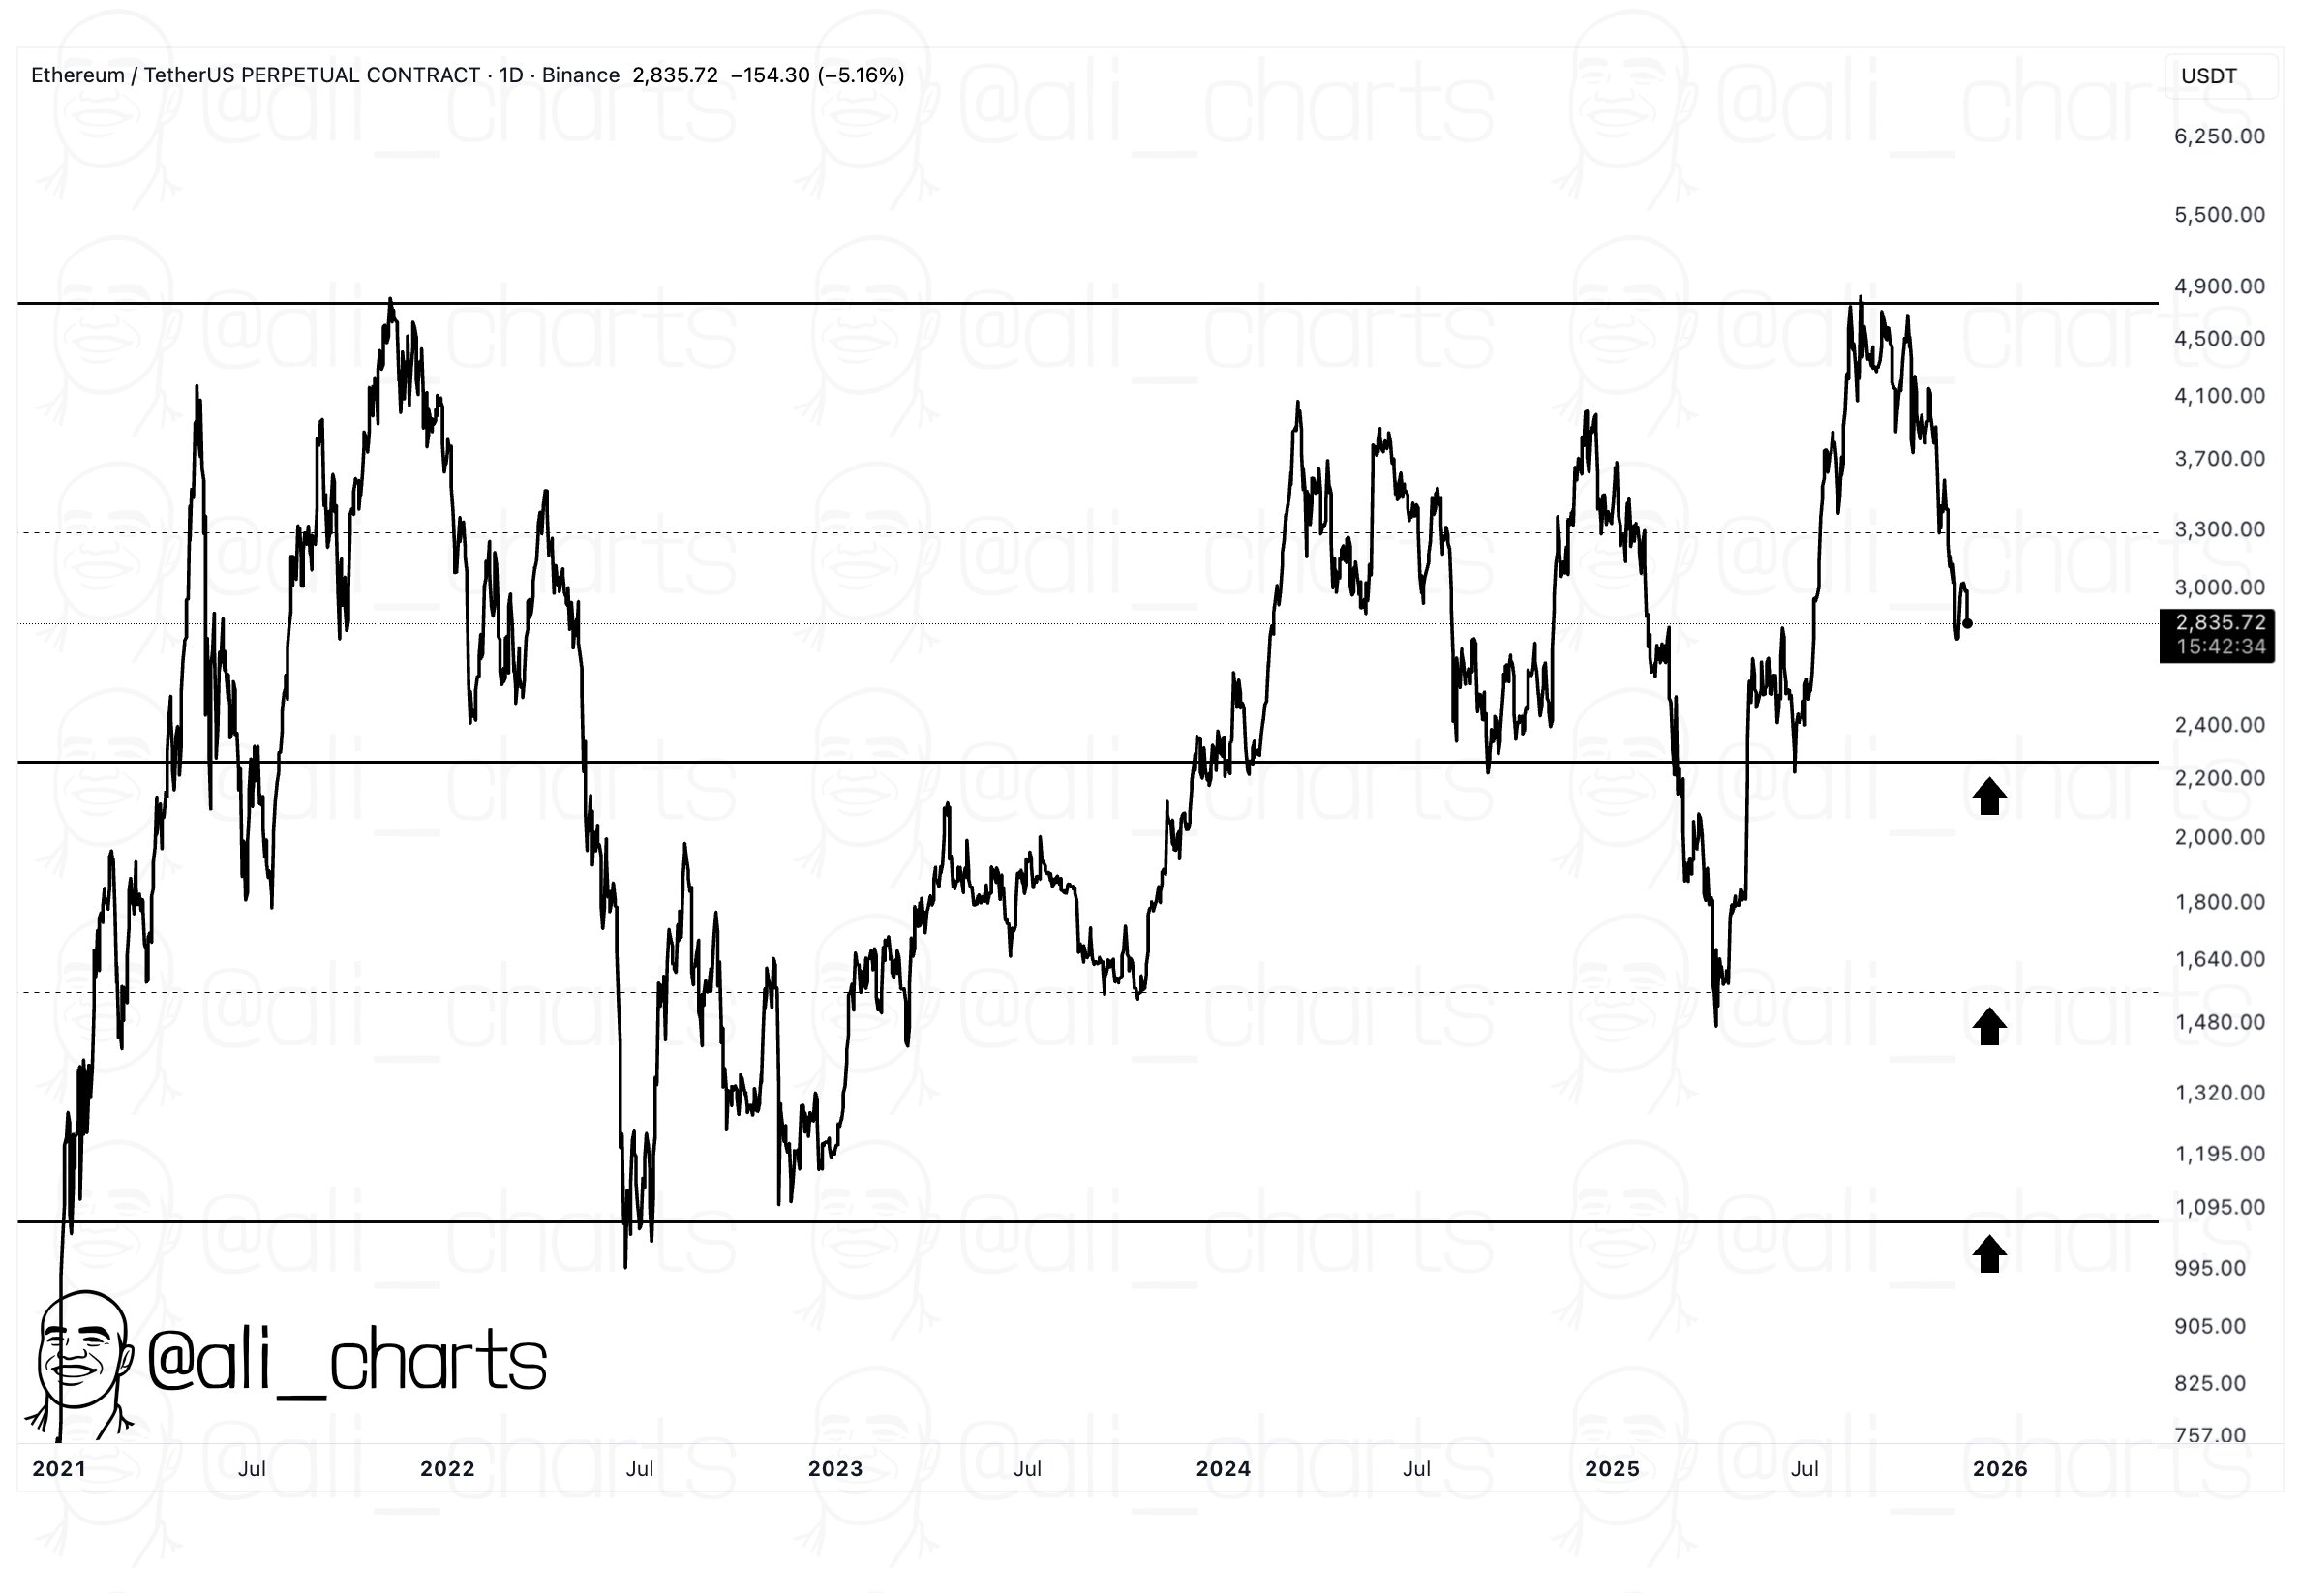
XRP isn’t the only cryptocurrency that has been following a Parallel Channel recently. As Martinez has pointed out in another X post, Ethereum‘s daily price has seemingly been trading inside such a pattern for a few years now.
XRP Price
XRP has shot up alongside the rest of the cryptocurrency sector as its price has recovered to $2.17.
You May Also Like

Huobi HTX will jointly launch NIGHT (Midnight) on December 9th, and will simultaneously add isolated margin trading for NIGHT/USDT (10X).

Can Bulls Defend the $2 Mark?
