Polkadot price prediction 2025-2031: Will DOT recapture $20 soon?
Key takeaways
- In 2025, Polkadot might reach a maximum price value of $3.06 and an average value of $2.87.
- In 2028, the DOT price is expected to range from a maximum of $16.64 to a minimum of $14.31.
- The price of Polkadot is predicted to reach a maximum value of $50.87 in 2031.
Polkadot (DOT) has shown impressive growth and resilience in a volatile cryptocurrency market, supported by its strong Polkadot protocol architecture, which ensures network security—and investor confidence. A major contributor to this success is the Sinai Upgrade on the Acala Network, which enhances functionality and security.
With over 32 million transactions validated in October 2024 by the Polkadot Relay Chain, the network demonstrates significant activity and utility, contributing to its substantial market capitalization. A notable increase in unique wallets further signals growing user adoption and engagement, strengthening Polkadot’s position as a leading blockchain platform. Will DOT reach new heights soon? Let’s get into the Polkadot price prediction for 2025-2031.
Overview
| Cryptocurrency | Polkadot |
| Token | DOT |
| Price | $2.30 |
| Market Cap | $4.27B |
| Trading Volume | $233.48M |
| Circulating Supply | 1.62B DOT |
| All-time High | $55.00 Nov 4, 2021 |
| All-time Low | $2.69 Aug 19, 2020 |
| 24-hour High | $2.43 |
| 24-hour Low | $2.27 |
Polkadot price prediction: Technical analysis
| Volatility | 13.02% |
| 50-Day SMA | $ 3.55 |
| 14-Day RSI | 37.49 |
| Sentiment | Bearish |
| Fear & Greed Index | 23 (Extreme Fear) |
| Green Days | 16/30 (53%) |
| 200-Day SMA | $ 3.94 |
Polkadot price analysis: DOT shows short-term weakness amid steady market interest
- DOT dropped 2.5% in 24 hours but remains attractive to traders.
- The Price is consolidating between $2.27 and $2.43, indicating a narrow, stable range.
- Breaking above $2.35 or below $2.27 could prompt stronger price moves and signal potential trend shifts.
On November 22, 2025, Polkadot (DOT) trades at $2.30, reflecting a 2.5% decline in the past 24 hours. The cryptocurrency has seen its price fluctuate between a low of $2.27 and a high of $2.43 during this period. Despite this short-term weakness, DOT continues to maintain interest among traders due to its strong ecosystem and historical performance, even though it remains far below its all-time high of $55.00 recorded in November 2021.
Polkadot daily price chart: DOT consolidates amid neutral momentum
The daily chart shows DOT encountering repeated resistance around $2.43, with sellers stepping in at this level, preventing any sustained upward movement. Support has held near $2.27, indicating that buyers are defending lower levels. Price oscillations between these points highlight consolidation, suggesting a narrow range-bound market. Trading volume has remained stable, reflecting steady interest but lacking momentum for a strong breakout.
 DOT/USDT Chart: TradingView
The Relative Strength Index (RSI) is hovering around 30 levels, indicating neither overbought nor oversold conditions. Moving averages suggest that DOT is trading slightly below the 20-day SMA, reflecting mild short-term bearish pressure. The chart also presents minor lower highs, which could signal a slow trend reversal if downward pressure continues. Traders should monitor intraday patterns, particularly the repeated dips followed by minor rebounds.
Polkadot 4-hour price chart: DOT faces a tight range as bearish pressure persists
The 4-hour chart shows DOT repeatedly testing resistance near $2.35, with short-lived recoveries failing to shift momentum. The price has formed a series of lower peaks and valleys, suggesting bearish pressure within a consolidation zone. Immediate support sits at $2.27, which has been tested multiple times without a breakdown, indicating temporary stability.
 DOT/USDT Chart: TradingView
Within this timeframe, technical indicators point to moderate selling pressure, as the MACD remains below its signal line. Short-term momentum oscillators imply the current range-bound movement is likely to continue unless DOT breaks above $2.35 or falls below $2.27. Intraday traders may target these key levels for tactical opportunities, while longer-term investors watch for a potential shift in trend.
Polkadot technical indicators: Levels and action
Daily simple moving average (SMA)
| Period | Value ($) | Action |
| SMA 3 | $ 3.00 | SELL |
| SMA 5 | $ 2.97 | SELL |
| SMA 10 | $ 3.04 | SELL |
| SMA 21 | $ 3.03 | SELL |
| SMA 50 | $ 3.55 | SELL |
| SMA 100 | $ 3.76 | SELL |
| SMA 200 | $ 3.94 | SELL |
Daily exponential moving average (EMA)
| Period | Value ($) | Action |
| EMA 3 | $ 3.15 | SELL |
| EMA 5 | $ 3.36 | SELL |
| EMA 10 | $ 3.59 | SELL |
| EMA 21 | $ 3.75 | BUY |
| EMA 50 | $ 3.85 | BUY |
| EMA 100 | $ 3.95 | SELL |
| EMA 200 | $ 4.26 | SELL |
What can you expect next for Polkadot (DOT)?
DOT is likely to remain range-bound between $2.27 and $2.43 in the short term as buyers and sellers hold steady. A move above $2.35 could spark a rebound, while a drop below $2.27 may lead to further weakness. Traders should watch these levels closely for potential opportunities, while long-term investors monitor for signs of a trend reversal.
Is Polkadot a good investment?
Polkadot remains attractive for investors interested in established blockchain projects with a strong ecosystem. Its historical performance and ongoing development activity support long-term potential, but the current price is far below its all-time high, reflecting short-term volatility. Investors should consider their risk tolerance, focusing on DOT’s fundamentals and market trends, while being mindful of range-bound conditions and potential breakouts or breakdowns.
Why is Polkadot Down today?
Polkadot’s recent 2.5% decline reflects short-term market weakness rather than fundamental issues. Traders are reacting to minor profit-taking and range-bound price action between $2.27 and $2.43. The lack of strong buying momentum and repeated resistance near $2.43 has kept upward gains limited, while broader crypto market sentiment remains cautious.
Recent news
Banxa, a global crypto infrastructure provider, has integrated with the Polkadot ecosystem to offer regulated fiat-to-crypto on and off-ramps, compliance solutions, and stablecoin access. This allows developers on Polkadot to onboard users with over 30 fiat currencies, including USD and EUR, and access stablecoins like USDC and USDT, as well as DOT.
Will Polkadot reach $10?
Yes, according to long-term predictions, Polkadot is projected to reach up to $10 by 2027, with expectations for next week also showing positive trends.
Will Polkadot reach $40?
Yes, according to the long-term predictions, Polkadot is projected to reach up to $40 by 2031.
Will Polkadot reach $100?
Reaching $100 for Polkadot (DOT) is highly ambitious and unlikely in the near term.
Does Polkadot have a promising long-term future?
Based on Polkadot’s ongoing buying demand and positive community support, the DOT price is set to make new highs in the coming years. However, you are advised to do your research before investing in the volatile market, especially considering future performance.
Polkadot price prediction November 2025
Here are the current Polkadot price movements in November 2025. The potential low is $2.54, while the current price might average around $2.61. On the higher end, DOT could reach up to $2.68.
| Month | Potential Low | Potential Average | Potential High |
| November | $2.54 | $2.61 | $2.68 |
Polkadot price prediction 2025
The DOT price prediction for 2025 anticipates a minimum value of $2.5 and a maximum value of $3.06. The token price and the coin’s average value could be around $2.87.
| Polkadot Price Prediction | Potential Low | Potential Average | Potential High |
| 2025 | $2.5 | $2.87 | $3.06 |
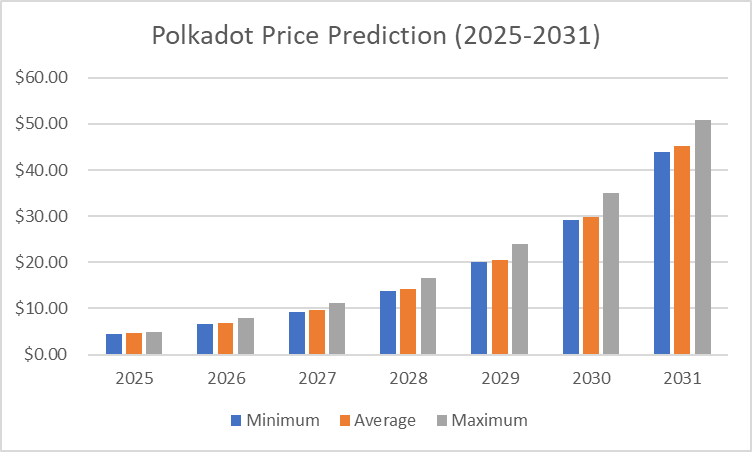
Polkadot Price Predictions 2026-2031
| Year | Minimum Price | Average Price | Maximum Price |
| 2026 | $6.59 | $6.78 | $7.88 |
| 2027 | $9.32 | $9.66 | $11.24 |
| 2028 | $13.83 | $14.31 | $16.64 |
| 2029 | $20.02 | $20.59 | $23.94 |
| 2030 | $29.10 | $29.92 | $35.03 |
| 2031 | $44.00 | $45.20 | $50.87 |
Polkadot price prediction 2026
According to the Polkadot prediction for 2026, DOT could reach a maximum price of $7.88, with the lowest price expected to be $6.59, and an average forecast price of $6.78.
Polkadot price prediction 2027
The price of Polkadot is predicted to reach a minimum value of $9.32 in 2027. Per expert analysis, DOT tokens could reach a maximum value of $11.24 and an average trading price of $9.66.
Polkadot price prediction 2028
Cryptopolitan predicts that in 2028, the Polkadot network will reach a minimum price level of $13.83, a maximum price of $16.64, and an average trading price of $14.31.
Polkadot forecast 2029
The price of Polkadot is predicted to reach a minimum value of $20.02 in 2029. Traders can anticipate a maximum value of $23.94 while monitoring key support levels and an average trading price of $20.59.
Polkadot price prediction 2030
According to the Polkadot price prediction for 2030, DOT could reach a maximum price of $35.03, a minimum price of $29.10, and an average forecast price of $29.92.
Polkadot price prediction 2031
In 2031, Polkadot’s price is predicted to reach a minimum level of $44.00. Should positive market sentiment persist, DOT can attain a maximum cost of $50.87 and an average trading price of $45.20.
 Polkadot Price Prediction 2025-2031
Polkadot market price prediction: Analysts’ DOT price forecast
| Firm | 2025 | 2026 |
| DigitalCoinPrice | $5.73 | $6.67 |
| Coincodex | $4.42 | $6.61 |
Cryptopolitan’s Polkadot (DOT) Price Prediction
For 2025, Polkadot is expected to trade between $2.50 and $3.06, with an average price near $2.80. Continued network growth and adoption could support gradual gains. By 2031, DOT could reach up to $50.87 if ecosystem expansion and market conditions remain favorable.
Polkadot historic price sentiment
- After spending most of the second half of 2020 trading around $4-$5, the price broke above the previous all-time high of $7 on December 29 and quickly reached the Polkadot price projection of $10.
 Polkadot price history | Coinmarketcap
- Polkadot experienced rapid growth, with its price climbing from around $3 in January to an all-time high of approximately $57.50 in May 2021.
- After the peak, the price declined sharply, falling to around $10 by July before partially recovering to over $40 in November 2021.
- In 2022, Polkadot price steadily declined, starting the year around $30 and dropping below $10 by mid-year.
- By the end of 2022, the price stabilized near $5 as bearish market conditions dominated the cryptocurrency space.
- The price of DOT hovered between $5 and $7 for most of 2023, reflecting a period of consolidation and limited market excitement.
- In January 2024, Polkadot’s price remained relatively stable, trading around the $5–$6 range.
- By July 2024, Polkadot showed slight signs of recovery, with its price rising to around $7–$8. This modest uptick was likely driven by increasing market interest.
- In December 2024, Polkadot showed signs of recovery, with its price climbing to around $10.4.
- In January 2025, Polkadot peaked at $7.98 but lost momentum towards the end of the month, resulting in a trading range of $4.64 to $5.28 in February.
- In March 2025, Polkadot (DOT) traded at approximately $4.30.
- In April 2025, Polkadot (DOT) experienced a gradual downtrend, with its price hovering slightly below the $4 mark amid ongoing market volatility.
- In May, Polkadot (DOT) began trading at around $ 4.10 and exhibited moderate fluctuations. As of the latest update, the price has declined slightly and is currently hovering near $ 3.90, reflecting a mild bearish trend so far.
- Polkadot (DOT) declined from a high of around $4.20 to approximately $3.30 in June, with a consistent downtrend and brief rebounds near $3.60 in July.
- In August 2025, Polkadot traded around $4.10, maintaining a steady pace with limited volatility. The price slightly dipped during September 2025, hovering near $4.00 as market sentiment remained neutral.
- By October 2025, DOT showed mild recovery, trading near $4.30, suggesting cautious accumulation among traders amid broader market stabilization.
- As of November 2025, Polkadot price fluctuated between $2.55 and $2.67 before stabilizing around $2.60.
You May Also Like
XRP Near $2 as ETFs Smash $1B AUM — Institutional Money Quietly Takes Over

Unprecedented Surge: Gold Price Hits Astounding New Record High